Coding Assignment 4 – Network

Concept:

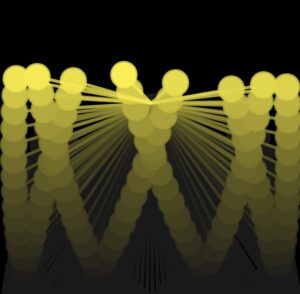
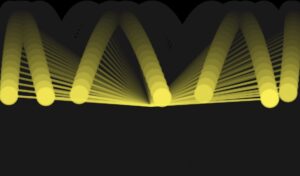
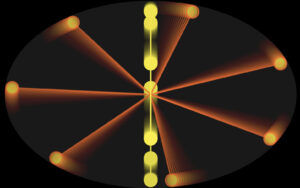
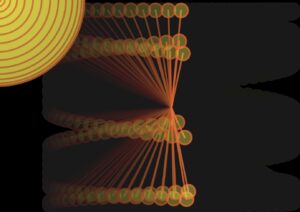
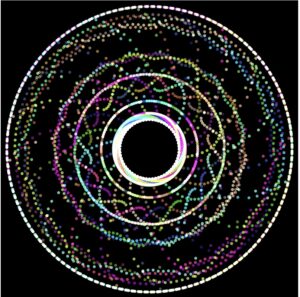
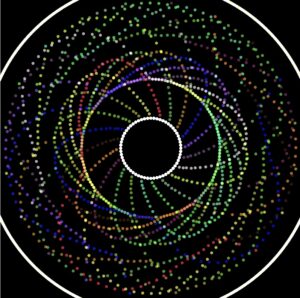
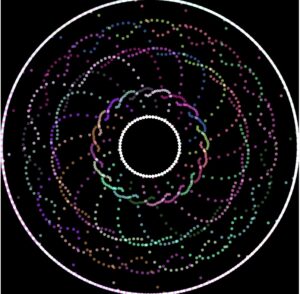
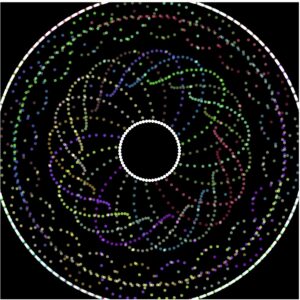
For this week’s assignment, I was inspired by the mystique of celestial bodies and quantum mechanics to create a network of dynamically connected particles gravitating around the mouse coordinates. It involves particle interaction, attraction, acceleration, and velocity. The number of particles starts low and gradually increases to reach 350, alongside their opacity and size. Upon mouse movement, the particles follow slowly the coordinates with some noise introduced implicitly.

Code: https://editor.p5js.org/bdr/sketches/ekie7vlHu

Code Walkthrough:

Particle Class:

Constructor: each particle is initialized with a random position, velocity, and an initial distance vector.

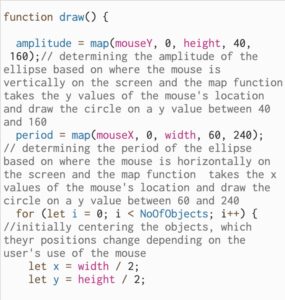
Update(): It is responsible for updating the particle’s position based on its velocity and applying boundaries to ensure particles stay within the canvas. It also calculates the acceleration pointing towards the mouse cursor and adds it to the particle’s velocity, creating an attraction effect.

update() {
        if (this.position.x > width / 2 || this.position.x < -width / 2 || this.position.y > height / 2 || this.position.y < -height / 2) {
            this.position = createVector(random(-150, 150), random(-150, 150));
            this.velocity = createVector(random(-0.5, 1), random(-0.5, 1));
        }
        let m = createVector(mouseX - width/2, mouseY - height/2);
        let acceleration = p5.Vector.sub(m, this.position);

        acceleration.setMag(0.5);
        this.velocity.add(acceleration);
        this.position.add(this.velocity);
}

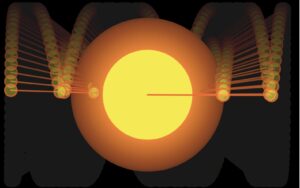
Display(): Mainly to display the particles. It calculates the distance vector to track proximity to other particles to later draw the connecting line.

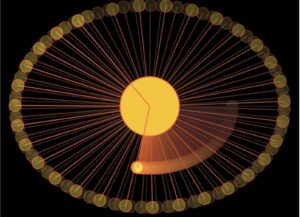
As the network grows bigger, the transparency of the connecting line decreases. The particles – filled circles – are replaced with larger non-filled ellipses.

stroke(255, 0, 0, this.distance.x + this.distance.y);

Draw Function:

Translate(): translates the coordinate system to the center of the canvas to make it easier to work with particle positions.

To gradually create multiple instances of particles, I’m adding one particle at every iteration.

The line is drawn using the following:

for (i=0; i<particles.length; i++) {
        particles[i].display();
        for (j=0; j<particles.length; j++) {
            if (i!=j){
                if (particles[i].position.x <= particles[j].position.x + 28 && particles[i].position.x >= particles[j].position.x - 28) {
                    if (particles[i].position.y <= particles[j].position.y + 28 && particles[i].position.y >= particles[j].position.y - 28) {
                        stroke(255, 0, 0, particles[i].distance.x + particles[i].distance.y);
                        line(particles[i].position.x, particles[i].position.y, particles[j].position.x, particles[j].position.y);
                    }
                }
            }
        }
    }
Challenges:

One of the challenges that I have faced is certainly the computational power.  Having ore particles means needing more power and therefore sacrificing speed. Hence keeping the max to 350.

Improvements:

Repulsion force: Add repulsion forces alongside attraction
Wind force using mouse movement/click: Upon using the mouse, the particles will move away following the wind movement and power.

Coding Assignment “Northern Lights” – Week 4

Concept and Approach:

For this assignment  I decided through utilizing simple harmonic motion to attempt to mimic the look of the Northern Lights. In terms of coding, my approach was quite simple, I focused mostly on the colors, their opacities, and angles, to achieve the effect of the aurora.

To start off I used the simple harmonic motion code we worked on in class as a basis, I then followed Daniel Schiffman’s video  that details the basics of creative coding with simple harmonic motion:

Similar to Schiffman’s method I created an array of shapes that move in a simple harmonic motion but instead of having my shapes be based on the built in shape functions of p5js I used the ‘begin/ end shape’ functions. Through these functions I was able to create my own shapes that look somewhat similar to what I imagine the aurora to look like.

Because I was layering the same shapes on top of each other to achieve the effect I am looking for I decided to place my wave shape into a class that I could call to create as many layers of the waves as needed in different positions.

<iframe src=”https://editor.p5js.org/dhabialhosani/full/DpbyDHhHa”></iframe>

Two elements that I am particularly proud of are the use of the ‘perlin noise’ function and the jagged effect I achieved through the shift of the vertices. When I first created the layers without the perlin noise function, they looked somewhat unnatural with their position and angling. When introducing the ‘noise’ function the program generated more natural looking patterns.

beginShape();
    // looping for the length of the angles array 
    for (let i = 0; i < angles.length; i++) 
    {
      strokeWeight(1);
      stroke(this.waveColor);
      // calculate x, y coordinates based on a perlin noise value that is affected by a sine wave 
      let y = map(noise(this.amplitude*(sin(angles[i] + this.c)) + this.d), -1, 1, this.minMapY, this.maxMapY);
      let x = map(i, 0, angles.length, this.minMapX, this.maxMapX);
      // vertex point for wave
      vertex(x, y);
      // another vertex to left (gives jagged effect)
      vertex(x - 100, y - 400);
      // increment to have waves moving
      angles[i] += 0.001;
    }
    endShape();
  }

In terms of the effect achieved with the shape, I was very confused as to how I am supposed to create it, at first I attempted to use rectangles, however I wasn’t satisfied with the outcome. I realized then that I could create a series of lines that move in a simple harmonic motion through just using the vertex function with the coordinates. By adjusting the coordinates and creating shifts in their values, I was able to achieve the desired look.

Reflection and Ideas:

While I took a rather simple route with this assignment I still feel like I learnt a lot and realized the power of the sine waves when it comes to creative coding. One thing I would like to further explore is the additive waves, as right now my code relies more on the perlin noise function to create a randomized wave effect. With the additive waves I feel like I could create a more consistent yet natural fluctuating look that could possibly make the design look better. I also would like to further experiment with colors and their opacities to see if I could create a mix in saturations and vibrancies.

Code for Reference: 

https://editor.p5js.org/dhabialhosani/sketches/DpbyDHhHa

Assignment 4 – Beauty of Harmonic Motion

In this assignment, I wanted to see the power of sine waves in creating smooth and soothing effects. Therefore, I have built up my assignment on something we had experimented in class.

There are two waves in this sketch. One wave has a longer period of 2π, and another has a shorter period of π/2. I wanted to experiment a different approach on how the waves could be shown like they’re moving. Therefore, I added an offset variable that increments by 0.8 on every frame. In the draw function this offset is used to translate the positions.

Now, when the y position of the vertex (or ellipse in this sketch) gets updated, it feels like the waves are moving.

Then I tried adding traces of the waves using alpha  value in the background() function:

background('rgba(13, 39, 54, 0.025)')

This would keep adding faded layers of dark greenish background so it appears like the waves are leaving traces.

Here’s the code used to build the sketch:

let offset = 0;

function setup() {
  createCanvas(600, 600);
  background(0);
}

function yVal(x, period, phase, amplitude) {
  return sin((TWO_PI * x) / period + phase) * amplitude;
}

function draw() {
  background("rgba(13, 39, 54, 0.025)");

  translate(width / 2 - offset, height / 2);
  offset += 0.8;

  for (let i = -width / 2 + offset; i <= width / 2 + offset; i += 10) {
    let x = map(i, -width / 2, width / 2, -PI, PI);

    stroke(0, 255, 255, 0.1);
    strokeWeight(10);
    ellipse(i, -yVal(x, TWO_PI, 0, height / 6), 4);

    strokeWeight(1);
    ellipse(i, yVal(x, PI / 2, 0, height / 3), 3);
  }
}

Future Considerations

I would love to add more waves and lines to show a few parts of the waves connected to each other. Also, I would like to create more complex wave patterns by introducing reversed sine waves with varying periods,  and amplitudes.

Xiaozao Coding Assignment #4

Coding Assignment #4 – Simple Harmonic Motion

This week, we are drawing inspiration from Memo Akten and creating some simple harmonic motion using the sine wave. I created three sketches. But before introducing them, let me explain my organized code structure of the sine wave class.

In the class, we analyzed the three attributes of a sine wave: the amplitude, the period, and the phase. And we used a formula to calculate the corresponding x and y positions of the balls.

let y = sin((TWO_PI*x)/period+phase_shift)*amp;

However, if we want to further manipulate the motion of the balls, it’s better to create a class. And with all these attributes of the class object, we can break down the calculation of the objects’ position into sub-steps, which, in my perspective, is easier to understand. Here’s the class structure that I reorganized.

let gap = 10;
let w = 600;
let h = 600;
let num = w/gap;
let period = 2; // length of two whole periods = width of the canvas
let phase = 0; // starting x-offset
let phase_shift = 0.01; // phase shifting speed
let amp = 100;

let joints = [];


function setup() {
  
  createCanvas(w, h);
  background(0);
  noFill();
  strokeWeight(2);
  stroke(255);
  
  let total_angle = period * 2 * PI;
  for (let x = gap; x < w; x += gap) {
    let this_angle = map(x, 0, w, 0, total_angle);
    joints.push(new Joint(x, 0, this_angle));
  }
  
}


function draw() {
  
  background(0);
  
  for (let i = 0; i < joints.length; i ++) {
    let joint = joints[i];
    joint.update();
    joint.display();
  }
  
}


class Joint {
  constructor(x, y, angle) {
    this.x = x;
    this.y = y;
    this.angle = angle;
    this.r = gap*0.7;
    this.phase = phase; // set a phase for each class object
  }
  
  update() {
    this.y = amp * sin(this.angle + this.phase);
    this.phase += phase_shift;
    
  }
  
  display() {
    push();
    translate(0, h/2);
    // lines
    line(this.x, 0, this.x, this.y);
    
    // balls
    ellipse(this.x, this.y, this.r);
    pop();
  }
}

As you can see, I first defined the parameters at the beginning of the code. Then in setup(), I create a set of objects of the Joint class according to the x position of them. Now they all have the same period, but it’s easy to modify if needed. Then the essential parameters are passed through the constructor() function be become class attributes. In the update() function, I calculate the y position in a simpler formula, because I don’t need to consider the period as it’s already dealt with in the previous steps and is ready to be invoked. Finally, I call the display() function for each joint in the draw() loop.

By customizing the parameters at the beginning and the formula in the update function, we can change the motion pattern more efficiently.

1. Manta Ray

This is a really simple but harmonic motion. I think it looks like a manta ray swimming in the ocean, and staring at it calms me down.

I mainly changed the period of each joint so that the joints near the edge of the canvas have a slower period and the joints in the middle have a faster period. Also, I make the amplitude of the joints in the middle a bit larger.

function setup() {
  
  createCanvas(w, h);
  // frameRate(600);
  background(0);
  noFill();
  strokeWeight(2);
  stroke(255);
  
  
  for (let x = gap; x < w; x += gap) {
    let this_period = abs(w-x)/500;
    let total_angle = this_period * 2 * PI;
    let this_angle = map(x, 0, w, 0, total_angle);
    joints.push(new Joint(x, 0, this_angle, log(w/2-abs(w/2-x))*30));
  }
  
}


2. Linked Nodes

This one is more directly inspired by Memo’s work. Basically, I adjusted the phase of every joint. In other words, you can imagine that they have the same period but are moving along the X-axis at different speeds. At some point, the y positions reach zero at the same time and align with each other.

The most important line of code:

let this_shift = (x+w/2)/20000;

Also, I draw an alpha line between two nodes if the distance between them falls in a certain range.

3. Flower Generator

This one is also interesting. I positioned the joints around a circle and also modified the phase. And it created a really beautiful effect!

Reflection:

The most important takeaway from this exercise is that I learned to use different ways to draw my joints. Sometimes (especially when it comes to circular patterns) it gets hard to use the concept of period, therefore you have to find a different way to utilize the sine wave. For example, I found that adjusting the phase-shifting speed is much simpler and intuitive. After all, a sin wave is kind of a “relative” concept. You never know its scale before comparing it to another thing’s scale. So, if it is an intensive sine wave, you can either say that it has a rather short period or it is shifting rather fast along the time axis. Therefore we can be flexible when writing our code as long as we are clear about what to do!

And although randomly trying can sometimes generate unexpected beautiful results, it’s still important to understand the principle and design your outcome purposefully.

By the way, I also tried to combine multiple sine waves of different amplitude and period:

Assignment 4: Harmonic Motion of Gaussian Distribution

Project Description

Overview

This project is an interactive visual representation of simple harmonic motion, inspired by the Gaussian distribution curve, using P5.js. It creates a captivating display of 3D hexagons that rotate in the XY-plane while also oscillating in the Z-axis. Each hexagon has a progressively smaller radius than the one before it and undergoes harmonic motion both in terms of its position and color, resembling the shape of a Gaussian distribution curve.

Motivation

The motivation behind this project stems from the fascination with the Gaussian distribution, also known as the normal distribution or bell curve. The Gaussian distribution is a fundamental concept in statistics and probability theory, frequently encountered in various scientific and real-world contexts. It describes the probability distribution of a continuous random variable and is characterized by its symmetric, bell-shaped curve.

This project seeks to bridge the gap between the abstract beauty of mathematical concepts and their visual representation in art and technology. By drawing inspiration from the Gaussian distribution, it aims to provide an engaging and aesthetically pleasing way to explore the principles of simple harmonic motion. The visual resemblance to the Gaussian curve adds a layer of intrigue and connection to a concept that might otherwise be considered purely mathematical.

Project Appearance

The project presents a visually stunning 3D animation that draws inspiration from the Gaussian distribution curve. Here’s what you can expect:

  • Hexagons: There are 50 hexagons in total, each positioned in 3D space. The hexagons are arranged in a spiral pattern, with each hexagon having a smaller radius than the previous one, creating a visually appealing tapering effect.
  • Rotation: Each hexagon continuously rotates in the XY-plane. The rotation is driven by trigonometric functions, with the cos() function controlling the x-coordinate and the sin() function controlling the y-coordinate. This results in a circular movement for each hexagon, but with distinct positions and paces for each one.
  • Harmonic Motion: The project utilizes the sin() function on the current time value to manipulate the z-coordinate of each hexagon. This creates a mesmerizing effect where each hexagon appears to rise and fall in a harmonic motion pattern along the Z-axis, resembling the peaks and troughs of a Gaussian distribution curve.
  • Color Transformation: The project goes one step further by applying harmonic motion to the color of each hexagon. Custom RGB colors are generated by applying sin() and cos() functions to the time value. As a result, the colors of the hexagons smoothly transition, creating a beautiful visual representation that closely resembles the colors associated with a Gaussian distribution curve.

Demo

Link to the source code

Conclusion

In summary, this P5.js project is a captivating visualization of simple harmonic motion in 3D space, inspired by the shape of a Gaussian distribution curve. It features a mesmerizing spiral of rotating hexagons, with each hexagon undergoing harmonic motion along the Z-axis and experiencing a harmonious color transformation that evokes the colors of a Gaussian distribution. The project beautifully bridges the worlds of mathematics, art, and coding, offering a visually striking and educational representation of harmonic motion and probability distributions.

Coding Assignment – Week #4 – Mexican wave/ Newton cradle

So for my assignment this week, I really wanted to recreate either a Mexican wave or newton cradle but ended up kind of mixing the two together.

Trying to perfect the Newton Cradle was much harder than I thought so I started off with the following. It was a simple repetitive Mexican wave kind of motion that did not slow down.

After that example, I wanted there to be some periods so I added the following code so that the i variable would be a dependable factor and I achieved the following. I particularly like the look of when it regroups again and looks like it is starting fresh.

let period = 0.01 + i / 100;

I then wanted it to slow down after some time and add some colour, I liked the look of the HSB colour grid I used in my first assignment so I decided to add that again to achieve the following.

The slowing down effect took a lot more time then expected and I had to add a few Boolean variables and a few conditional statements.


if (
      this.period.x < 0.005 &&
      this.period.y < 0.005 &&
      this.pos.x === this.origin.x &&
      this.pos.y === this.origin.y
    ) {
      this.period.set(0, 0); // Reset the period to its original value
      this.ampl_x = 0;
      this.ampl_y = 0;
      slowingDown = true; // Set the flag to stop updating particles
    } else {
      this.pos.x = x + this.origin.x;
      this.angle.add(this.period); // Update the movement
    }
  }


https://editor.p5js.org/kk4827/full/llEuwJDBz

Improvements

I would love to try to implement the Newton cradle, maybe for my midterm and have the visuals look very compelling to real life and possible have some music or notes associated as each ball is hit upon.


Week 4 Assignment

Concept:

Keeping in mind that we’re supposed to include oscillation, sine waves, and harmonic motion into this assignment, I went through a few examples that demonstrated each one to get a better grasp of each concept, such as the oscillation examples, sine waves example, and harmonic motion video. And taking inspiration from Memo Atken, I also wanted to give a glowing, echoing, almost a “neon” effect like how it’s shown below: 

After watching the tutorials and doing a few practice examples, I really liked the idea of creating x-oscillation and y-oscillation and playing with properties of the two, and the image that I could produce with that.

Highlights:

In order to create the yo-yo effect, I learned that I need to map the y-position instead of mapping the size of the circle itself.

I ended up trying a few different combinations with the x-oscillation and the y-oscillation and creating x1, x2, y1, y2 for each amplitude and angle.

Here are some pictures of the trials I had:

Finally, I decided to try to portray the sun and our solar system by altering this part of the code, which I can say is the biggest highlight from my entire coding process:

let x1 = map(cos(angle2), -1, 1, -ampx1, ampx1);
  let x2 = map(cos(angle1), -1, 1, -ampx2, ampx2);

let y1 = map(sin(angle2), -1, 1, -ampy1, ampy1);
  let y2 = map(sin(angle1), -1, 1, -ampy2, ampy2);

Some of the key variables in my code are:

angle1, angle2, angle3 –> represent the initial angles for the motion of the elements.
angleV1, angleV2, angleV3 –> control the speed and proximity of each “yo-yo.”

I played around by switching whether to put angle1 or angle2 into the x and y coordinates, and they all gave me different results and patterns, but this was the combination (x1 – angle2, x2 – angle1, y1 – angle2, y2 – angle1) that gave me the “spinning” or “orbiting” design.

Then I also added a oscillating/”breathing” circle in the middle of the canvas, which I took inspiration and made alterations from the class example that we did. This acted as my “sun,” for it is placed at the center of the orbit system; moreover, the “glowing” effect that I achieved through this snippet of code below was also helpful in making the circle look more like a sun.

background(0, 4); //gives that glowing effect

I also altered the number times the width or height of each ampx1, ampx2, ampy1, and ampy2 to set how big they will draw the patterns – setting both ampx1 and ampy1 to 0.55 *  width or height resulted in the drawing of the smaller orbit that’s closer to the sun, as shown below.

let ampx1 = (0.55 * width) / 2;
let ampx2 = (0.9 * width) / 2;

let ampy1 = (0.55 * height) / 2;
let ampy2 = (0.9 * height) / 2;

Finally, the last highlight of my code was altering the angleV function, which I realized controls the speed and proximity of each “yo-yo.” For example, when I set angleV1 to a small number (i.e. 0.2), it resulted in this visual outlook, which proved that it was moving in a much faster speed and also in a more spread out manner from each other. Below is the code snippet and the image of how it looked:

let angleV1 = 0.9;
let angleV2 = 0.015;

And here’s the final sketch:

Reflection:

Professor Aya suggested that I change the middle linear element that currently has a circular motion to behave as a pendulum or some sort of a spring to add further variation to my sketch, but unfortunately I didn’t have enough time or the brains to figure that out in time. However, I do think that would be a fun improvement that I can add to the sketch!

Another question I had was figuring out how to make the circle in the middle expand in a consistent speed, because I realized that the longer the code runs, the faster the circle expands and shrinks. However, as for the time being, I’m happy with the result that I have!

Coding Assignment Week #4 – Simple Harmonic Motion Art

Inspiration: 

Ceiling Medallion Stencils - Custom Ceiling Design - Paint Stencils – Modello® Designs

Premium Vector | Circle pattern cnc design vector clip art vector hand drawn stencil element collection


One thing I really enjoyed as a child was making art using the circular stencils, its easy and follows unexpected patterns, yet draws stunning patterns and art! For that reason, I implemented this interactive art making program that works using trig functions (sin and cosine), amplitude and period, and of course the mouse for user interactivity.

Program/Code Explanation:

What I implemented is an interactive sketch that involves a dynamic pattern of 20 ellipses being displayed on a canvas based on sin and cosine functions. The ellipses’ properties are influenced by the position of the mouse, which is what initiates the user interactivity .

 Future Improvements:

As I concluded this project, I began to wonder whether I can integrate randomness to the way the patterns are drawn rather than mouse/user interactivity. I also feel like it would be really cool, although perhaps difficult, to control the movement with other senses rather than touching the mouse board, maybe perhaps integrating one’s voice and controlling the movement with high/low pitch voice as a form of interactivity.


Coding Assignment – Week #4

For this assignment, I aimed to create an animated visual pattern using ellipses that oscillate back and forth in a circular motion. The key concept behind this project is the use of trigonometric functions (sine and cosine) to control the position and size of the ellipses over time. Additionally, the animation changes direction resulting in a dynamic visual effect. Since the goal of the assignment was to create a harmonic motion, my inspiration or the starting point was the sine and cosine functions in itself rather than a wish to recreate something in particular.

Here is the final sketch:


One of the more challenging parts was the math behind the sketch. First, by using sin and cos together for x and y coordinates, respectively, I was able to trace points on the unit circle. The variable i is used as an angle that varies from 0 to  2π and therefore a full circle is completed. The effect of f is to control the frequency of the oscillation. As f increases, it speeds up the oscillation, making the ellipses move more rapidly from side to side.  I wish I could explain the radius calculation better, but honestly, it was just a random experimentation of plugging in random values and functions until I achieved a smooth transition (a trial and error method more of).

// Looping through 600 iterations to create a series of ellipses
  for (let i = 0; i < TWO_PI; i++) {
    // Calculating the x and y coordinates of the ellipse. Using sin and cos allows for the circular appearance
    let x = (width / 3) * sin(i * f);
    let y = (height / 3) * cos(i * f);
    // Radius is based on a combination of sine and cosine functions involving 't', 'i', and 'f', resulting in a changing size over time.
    let radius = 60 + 100 * sin(12 * sin(t) * sin(i * f));

Another challenge was changing the direction of the animation. I decided to switch directions once f reaches TWO_PI instead of when i does. This was also a personal preference, as I wanted the animation to loop for longer. I then switch the direction and set t and f to 0 to keep the animation from accelerating.

// Check if 'f' has completed a full loop (TWO_PI)
 if (abs(f) >= TWO_PI) {
   // Reverse the direction of motion
   direction *= -1;
   t=0
   f=0
 }

Some ideas for further enhancements could be implementing a smoother transition in the change of directions, as well as enhancing the visual appearance. I do like the fact that the visuals are rather simple and allow for focus on movement, structure, and shape, but I believe this sketch has more potential than only that. Speaking about the aesthetics, I was also quite satisfied with the rotateX(1) line, which enabled me to create a little more depth in the sketch and move slightly beyond the 2D view.

To add, this was actually where I started to notice some interesting dynamics. However, I found this initial pattern a bit too flashy and uncomfortable for the eye. In general, this assignment was an engaging and freehand experimentation with changes in values in the trial and error method until I achieved something that I liked. Here is the first sketch:

Coding assignment – week 4

This generative art piece draws its design from the interplay of geometry and motion. This week my main goal was to incorporate depth into my sketch, something I had never done before.


In the setup() function, I created a WebGL canvas. I also established an orthographic projection, so objects don’t appear smaller when they move away from the viewer.

The core of this artwork lies in the nested loops that traverse the canvas in both the X and Z dimensions (representing a 2D grid). Inside these loops, each iteration represents the creation of a box structure.

The height of each box (h) is determined by mapping the sine of the X-axis rotation angle. This mapping ensures that the boxes smoothly transition between different heights, adding to the calming effect. The stroke color (s) is derived from the sine of the Y-axis rotation angle, which results in a gentle shift in color shades across the artwork. Using the push() and pop() functions, we save and restore the transformation matrix to isolate the properties of each box.

Lastly, the angleX and angle Y values are incremented to create a continuous, slow rotation, producing a meditative motion within the artwork.

Code snipper

let h = floor(map(sin(aX), -1, 1, 50, 300)); // Map sine of X-angle to box height
let s = map(sin(aY), -1, 1, 100, 255); // Map sine of Y-angle to stroke color

Here, sin(aX )and sin(aY) are used to create a smooth oscillation as the boxes rotate. By mapping these values, I ensure that the height and color transitions remain serene. The mapping function allows to control the range of these transitions, resulting in varying box heights (h) and stroke colors (s) that contribute to the overall atmosphere of the artwork.

Challenges

I tried to incorporate more complex, unpredictable rotations that were user interactive, but I did not have enough time to flesh out the idea. Nevertheless, I am happy with the final sketch. I hope to make improvements in the future.