Proposal
For my midterm project, I want to try and imitate the weather forecast patterns that I would see as a child whenever I watched the news. I was raised in the UK so I primarily saw the weather in the UK but for my midterm, I want to include the countries that mean a lot to me and are different geographically compared to the UK which is an Island. I want to include the UAE as I study there and it is a coastal country, and Afghanistan as it is my home country but also a landlocked country. I think it would be nice to see how different environmental factors looks in these 3 countries as they are geographically different.
Underneath are some images of the news I would see for the UK and I have included some videos to show the kind of image I want to imitate.
Examples:
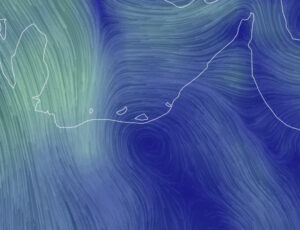 UAE / Gulf
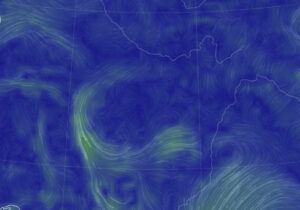 Afghanistan / Central Asia
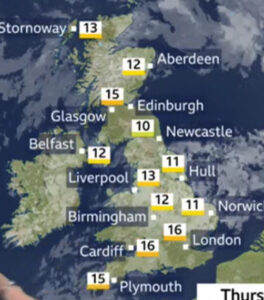
 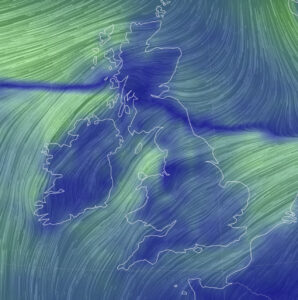 UK
UK
Concerns
Some aspects of this code that I am worried about it working with real life data and having the code perform for a certain amount of time to show the real-time wind. I think it will also be hard to locate my invisible attractors and with the outline of the countries, know where to locate these invisible attractors.
Line animation
I want to work on having the lines go towards invisible attractors or repel against them. I started off with having a blue background and the lines to imitate the wind to come out of the origin and have the lines be longer. This was just my starting point and I want to add a lifespan for these lines and have them concentrated next to each other. I also wanted to make sure the lines were using the Vector subclass from p5 so I used inheritance.
Now I want to add another attribute that will count as the lines lifetime so that they disappear over time and get popped from the array using splice. I have temporarily made the background black so I can see the white line disappear into the background.
I was looking at different ways to have the white lines be blended into the blue background and found the lerpColour function that did the job for me. I now want to add a single attractor so that my lines can move towards the attractor. Note: I am temporarily having all the code in the sketch.js file to makes it easier for me to create multiple copies of my code for documentation purposes.
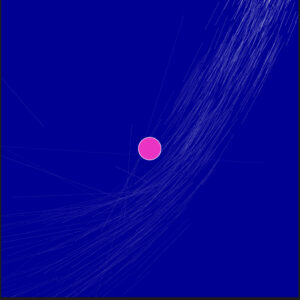
I also wanted to add a single attractor for now just so that I can see what the repel/ attraction would look like. I used the class Attractor from class and modified my Particle class for them to work well together whilst also extending on the p5.js folder. After playing around with the coordinates of the attractor, I ended up with the following effect which I really liked. I also made my canvas size 600 by 600 to see the effect better.
Screen Recording 2023-10-07 at 15.51.39
I moved the attractor around and played with the G values and positioning of the lines to be off the canvas so it seems more naturual when it comes and I got this effect.
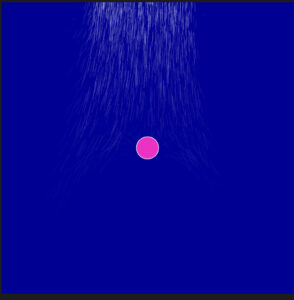
I also need repelling points so I will create an identical class but with a negative G value and I tried to see what it would look like and I really liked the look. I am likely to put these around the borders of the countries.
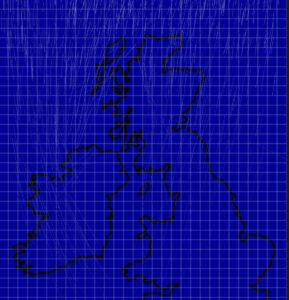
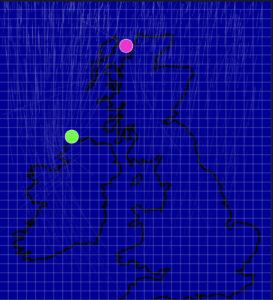
I will now try to find an image of the UK which is just the outline and have the waves be repelled against the borders. I found an image and tried to have some grids placed 20 pixels away from each other to try and see where I would want these attractors and repellers.
let spacing = 20;

  // Draw vertical grid lines
  for (let x = 0; x <= width; x += spacing) {
    line(x, 0, x, height);
  }

  // Draw horizontal grid lines
  for (let y = 0; y <= height; y += spacing) {
    line(0, y, width, y);}
I get the following image so now it is easier for me to see where I need to place my attractors and repellers. I am also going to duplicate my attractor class to create my repeller class. I also need to change the back ground colour or the ocean parts to be green to show a smooth distinction between the mainland and sea – this also includes any major lakes or bodies of water on the mainland.
To do list
- have the colour of the water be green/blue – different
- figure out the location of the attractors/ repellers
- have the wind waves be generated throughout the screen
- have the waves through the land go slower
With one attractor and repeller, this is what it currently looks like.
The pink is for the repeller and the green for the attractor.
Some sketches
Second Major Update
So after discussing other methods that I could use to try and create the effect I want, a classmate Xiaozao recommended at looking a force field approach to show a slower, curved and more natural effect. The video underneath is the video that helped me understand how vector fields worked in p5.js and how I can use them effectively to give the effect I wanted.
I firstly needed to find a way to create the vector field and luckily the video Xiaozao recommended was a great place to start. From what I had learnt, I know that I needed to have a second ‘background’ and have my centres of attraction generated randomly. We can use Perlin noise to have these randomly generated and also the curl value can really make a difference.
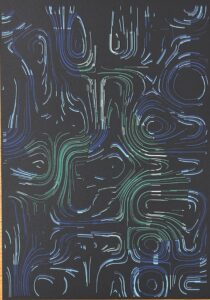
If this value is 1 or above, we will get the following images.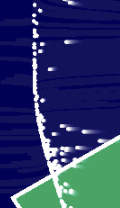
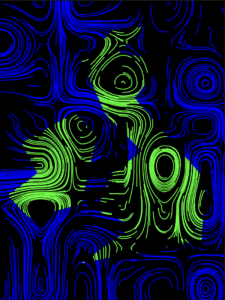
And of its less than 1 and significantly small, we get the following which is a strong attraction and the effect I wanted. 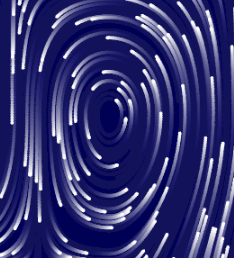
function curl(x, y) {
  const EPSILON = 0.0000001;
  let n1 = noise(x + EPSILON, y);
  let n2 = noise(x - EPSILON, y);
  let cx = (n1 - n2) / (0.9 * EPSILON);

  n1 = noise(x, y + EPSILON);
  n2 = noise(x, y - EPSILON);
  let cy = (n1 - n2) / (0.9 * EPSILON);

  return { x: cy, y: -cx };
}
Next thing I decided was to have some image or outline of the UK but trying to get these particular pixels was far too much of a hassle and would end up overcomplicating my code. Instead I decided to have the UK outline drawn out myself into 2 regions and used an image of the UK outline and a grid system to navigate myself to have these points placed.
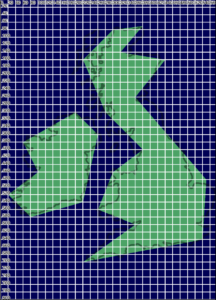
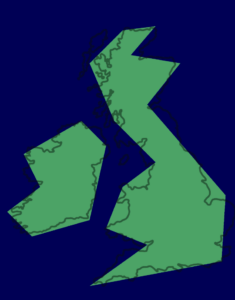
I also made sure these 2 shapes were saved so I can reference to thew pixels inside those regions.
let region1 = [];
let region2 = [];
function createShape1() {
  // Define the first region shape using curveVertex points
  region1.push({ x: 60, y: 380 });
  region1.push({ x: 200, y: 300 });
  region1.push({ x: 260, y: 360 });
  region1.push({ x: 220, y: 540 });
  region1.push({ x: 80, y: 580 });
  region1.push({ x: 40, y: 540 });
  region1.push({ x: 20, y: 520 });
  region1.push({ x: 100, y: 460 });
}

function createShape2() {
  // Define the second region shape using curveVertex points
  region2.push({ x: 300, y: 80 });
  region2.push({ x: 380, y: 70 });
  region2.push({ x: 320, y: 140 });
  region2.push({ x: 440, y: 160 });
  region2.push({ x: 360, y: 260 });
  region2.push({ x: 550, y: 480 });
  region2.push({ x: 540, y: 640 });
  region2.push({ x: 220, y: 700 });
  region2.push({ x: 360, y: 600 });
  region2.push({ x: 260, y: 560 });
  region2.push({ x: 300, y: 460 });
  region2.push({ x: 380, y: 400 });
  region2.push({ x: 280, y: 300 });
  region2.push({ x: 220, y: 160 });
}
I wanted to find a way to locate the pixels in these regions as I know I will need to make use of them in the future but as of now, this was my sketch.
INSERT
Plotting
So the next step I took was the plotting and I know I needed to simplify my code to make sure a plot was possible so I implemented a transparent background so that the particles paths were opaque and visible. I also made the background white and had the particles change colour instead, blue if in water and green for land.
I firstly used the following function to check whetehr to not the particle was in the land regions.
function pointInShape(point, shape) {
  // Check if a point is inside a shape defined by an array of vertices
  let oddNodes = false;
  let x = point.x;
  let y = point.y;

  for (let i = 0, j = shape.length - 1; i < shape.length; j = i++) {
    let xi = shape[i].x;
    let yi = shape[i].y;
    let xj = shape[j].x;
    let yj = shape[j].y;

    if ((yi < y && yj >= y) || (yj < y && yi >= y)) {
      if (xi + ((y - yi) / (yj - yi)) * (xj - xi) < x) {
        oddNodes = !oddNodes;
      }
    }
  }

  return oddNodes;
}
This way each individual pixel is checked and can change colour depending on the region. This is what my sketck ended up looking like for my SGV.
While plotting, I realised how much more dimension I wanted and I was able to edit by my SGV on Inkspace and have certain particles removed and have the colour changed. For example, some particles on the green region, I wanted white strokes to represent wind and on the ocean, pastel blue strokes to represent wind and waves.
These are some images and videos of my final plot.
Aftermath of Plotting
After seeing the additional dimension given in my plot, I wanted to add the same into my final sketch and I made use of the check in region function again and altered the sketch colour accordingly.
// Check if the particle is inside either of the regions
    let inRegion1 = pointInShape(p.pos, region1);
    let inRegion2 = pointInShape(p.pos, region2);

    if (inRegion1 || inRegion2) {
      // stroke(255); // White line
      stroke(110, 245, 137);
    } else {
      stroke(8, 196, 252);
      // stroke(139, 222, 247); // Pastel blue color
    }

    point(p.pos.x, p.pos.y);
  }
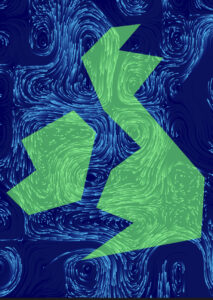
A final touch I added was some sound representing the wind and I though it went nicely with the movement of the particles and gave it that final missing touch.
Future Changes
Next time, I would like to have my other countries included. I realised through my project that I would not be able to show the other countries as well as they are not islands. I would also like to make this model in 3D so it is like the website example I was provided with. I also realised after time, the particles would almost disappear, I liked it initially but I wish they would regain speed after some time.