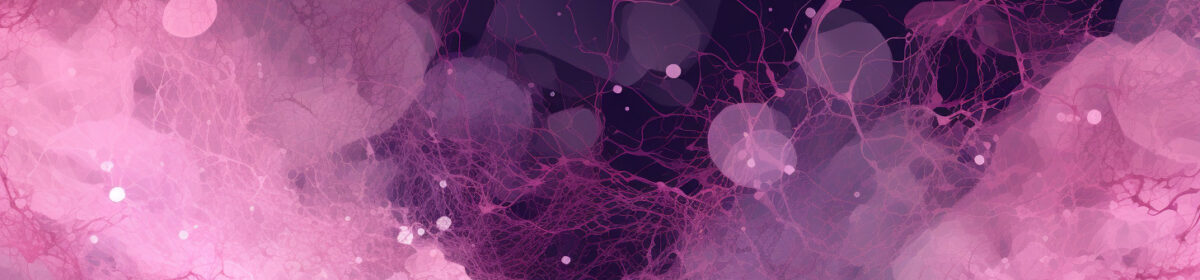
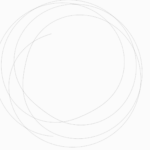
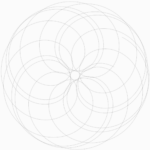
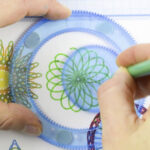
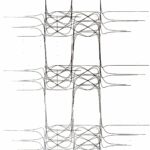
THE FINAL SKETCH
Click on the sketch to generate a new pattern!
Here is the full p5.js code: https://editor.p5js.org/shreyagoel81601/sketches/L2tFyyAnq
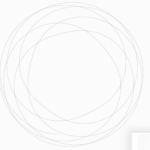
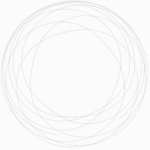
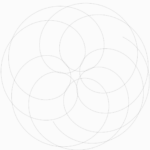
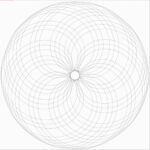
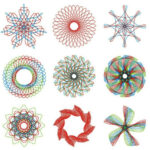
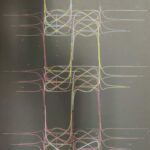
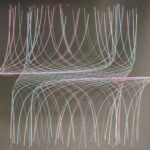
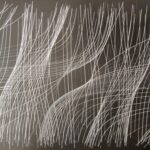
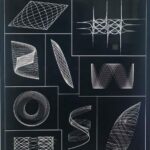
MY DESIGN GALLERY
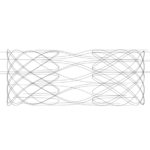
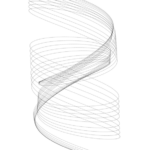
Below are the various different outputs I got from my above sketch:
CONCEPT, INSPIRATION & ARTISTIC VISION
How fascinating would it be to be able to visualize complex math equations into an easy-to-look generative design pattern? Fascinating no!
Math is everywhere around us, in the simplest to most complex of the things, but we don’t always necessarily see it as math. For this midterm project, I wanted to explore mathematical equations and find a way to visualize them using generative art and give them a visible form. But which equation? Or multiple equations? How do I choose?
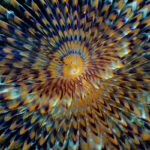
As a child, I most fondly played with the spirograph set (see pictures below). I would love to draw new designs and patterns through it. Different stencils and position of the pen give different designs.

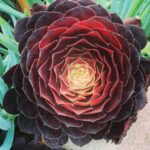
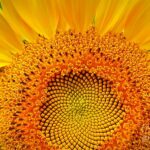
Some spirographs in nature:
Did you know there are actual math equations that trace the path / locus of these designs? For this project, I wanted to explore the math behind this concept and make generative art within this constraint. Can one equation by itself give rise to multiple varied distinguished designs? What are the the parameters of the equation which give it a certain characteristic? How does changing these parameters affect the design and feel of it?
I did some background research on mathematical equations and spirographs. This website explains the generation of spirographs and the equation behind it in simple terms. I carefully followed and read this as I evolved my idea, tried to code the designs and understood the math behind the visuals I was getting.
THE PROCESS
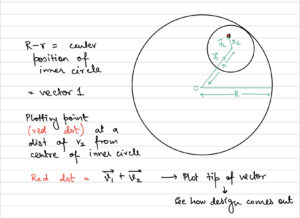
I started by understanding the physics behind the Spirographs and how they work. So it is essentially a circle within a circle with a point somewhere not in the centre in which you place your pen to create the designs. So I tried to model this using the physics concepts of vectors, position, their rectangular components, oscillation, sine and cosine, we learnt in class.
This was my starting sketch:
Based on some initial calculations that I did:
Here is the code snippet for it which exemplifies this vector behaviour:
translate(width/2, height/2);
circle(0, 0, R); // draw outer bigger circle
center = createVector((R/2-r/2)*cos(angle), (R/2-r/2)*sin(angle)); // center of the inner circle based on my calculations
circle(center.x, center.y, r); // draw inner circle
circle(center.x + r/2*cos(-1*angle), center.y + r/2*sin(-1*angle), 5); // draw the point of drawing --> currently at the boundary of inner circle
angle += 0.1; // increment angle each frame
The above behaviour achieved by simple physics and vectors has the following equation (this I derived myself, but can also be found online):
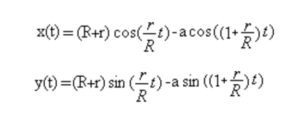
Going further, I realised it might be easier to get the equation version of the vector’s x and y position to plot it. How will this help? This will help in changing the shapes from circle to say ellipse, hyperbola or from changing the position of the smaller circle to be inside or outside, which would generate interesting and non-generic patterns. This is the time to be creative now!
I experimented with the different parameters like the R, r, t (= angle), and even the functions of sine, cosine, tan, and function enclosed function, along with the changing the sign / direction of vector addition / subtraction to generate different designs.
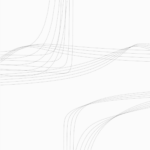
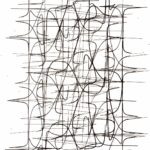
The multiple iterations and designs I created:
1. Code:
calculate() {
     this.x = (this.r+this.r)*(sin(this.angle))-this.d*0.41*tan((this.R-this.r)/this.r*this.angle*2);
     this.y = (this.R-this.r)*tan(sin(this.angle*1.8))+this.d*0.57*tan((this.R+this.r)/this.r*this.angle);
}
Outcome:
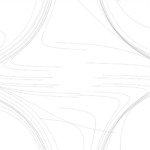
2. Code:
calculate() {
    this.x = (this.r+this.r)*(tan(this.angle))-this.d*0.41*tan((this.R-this.r)/this.r*this.angle*2);
    this.y = (this.R-this.r)*tan(sin(this.angle*1.8))+this.d*0.57*cos((this.R+this.r)/this.r*this.angle);
  }
Outcome:
calculate() {
    this.x = (this.R+this.r)*(cos(this.angle))-this.d*cos((this.R+this.r)/this.r*this.angle);
    this.y = (this.R+this.r)*(sin(this.angle))-this.d*sin((this.R+this.r)/this.r*this.angle);
  }
calculate() {
    this.x = (this.R+this.r)*(cos(this.angle)*2)-this.d*tan((this.R-this.r)/this.r*this.angle/2);
    this.y = (this.R-this.r*2)*(cos(this.angle))+this.d*tan((this.R-this.r)/this.r*this.angle);
  }
It is important to note that I did not have a design in mind that I found the code for. Rather, I took a basic math structure (the base formula) and altered and experimented with it. I wanted to see how far the equation can be taken, pushed beyond its limits, and by changing some of it parameters and characteristics (while keeping basic skeleton of the equation as it is), can we generate complex designs which are completely unexpected for its behaviour? And yes, that happened! I kept on experimenting with the values and functions until I found designs and patterns that I really liked and resonated with me. That is the part of the code I am proud of 🙂
PEN PLOTTING PROCESS
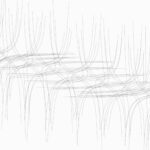
The pen plotting process was an absolutely fun process. I spent hours besides the plotter seeing my designs take form, changing the pen, putting the paper, changing the GoPro battery xD. Completely involved and engaged, I actually plotted 4 of my designs on the plotter and also prepared a matrix of some of my other designs also to be plotted.
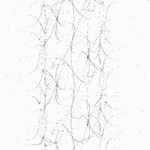
Here is the outcome of my designs:
I had to change my code from plotting dots to lines for the pen plotter since we cannot plot a million dots on the plotter. I did this by using the concept of storing the previous position (x, y) of the dot and drawing a line between the previous and the current position each frame.
Here is the code for it:
draw() {
    this.calculate();
    if (dist(this.x, this.y, this.prevX, this.prevY) > width/4) {
      this.prevX = this.x;
      this.prevY = this.y;
    }
    stroke(0,50);
    // point(this.x, this.y); // initially I was just plotting a point at the current x and y
    line(this.x, this.y, this.prevX, this.prevY); // now plotting a line between previous (x, y) and current (x, y)
    this.prevX = this.x;
    this.prevY = this.y;
    this.angle += 0.02;
  }
There is not much difference in the code per say, but the effect and feel of the design definitely changed. I like both the versions! 🙂
Hence, I decided to randomise dots versus dashes in the final sketch.
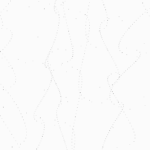
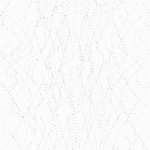
A peak into the working of the plotter:
FURTHER DEVELOPMENT