Midterm Project – Burst in a Bubble [FINAL]

I have finally finished my midterm project, plotting and printing and all!

In this post I will mostly talk about the pen plotting experience and the necessary adjustments I’ve made to my original code in order to help the machine understand and read the code.

Process of SVG:

I have tried two methods in trying to save my code as an SVG file during this midterm, which are the following:

  1. Implementing the SVG system into my p5js code so that I’ll be able to export an SVG file directly from my p5.js sketch.
  2. Converting a PNG file that I took from my p5.js sketch into SVG using a third-party program (using this Adobe converter).

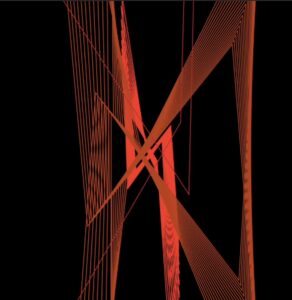
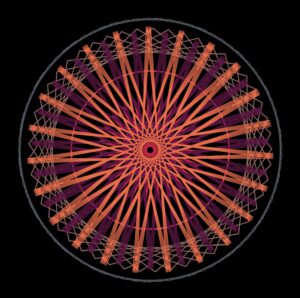
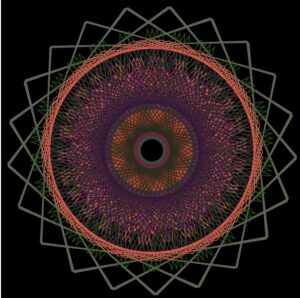
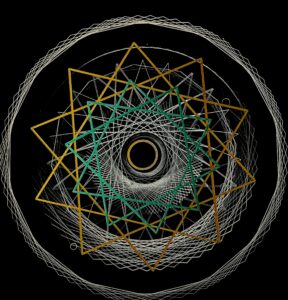
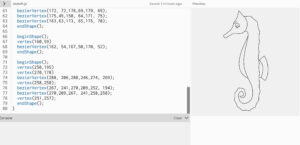
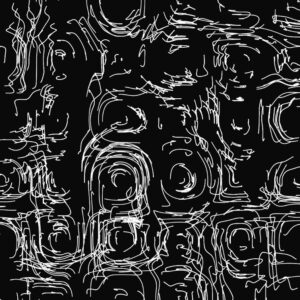
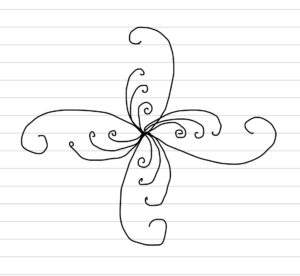
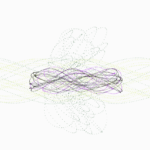
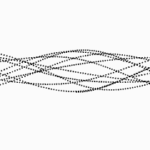
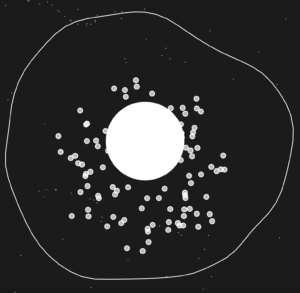
The first method did work in terms of exporting a snap of my sketch as an SVG file, but because my file was too big, I had to simplify my sketch a lot in order to make it successfully be exported as SVG like the following sketch:

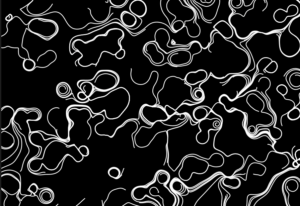
The second method also worked, but but I couldn’t remove the background in Inkscape for some reason, for it exported with the black background included like this:

So I tried to manually remove snippets of the background, but it was too tedious and basically impossible to generate a completely clean sketch with my skills.

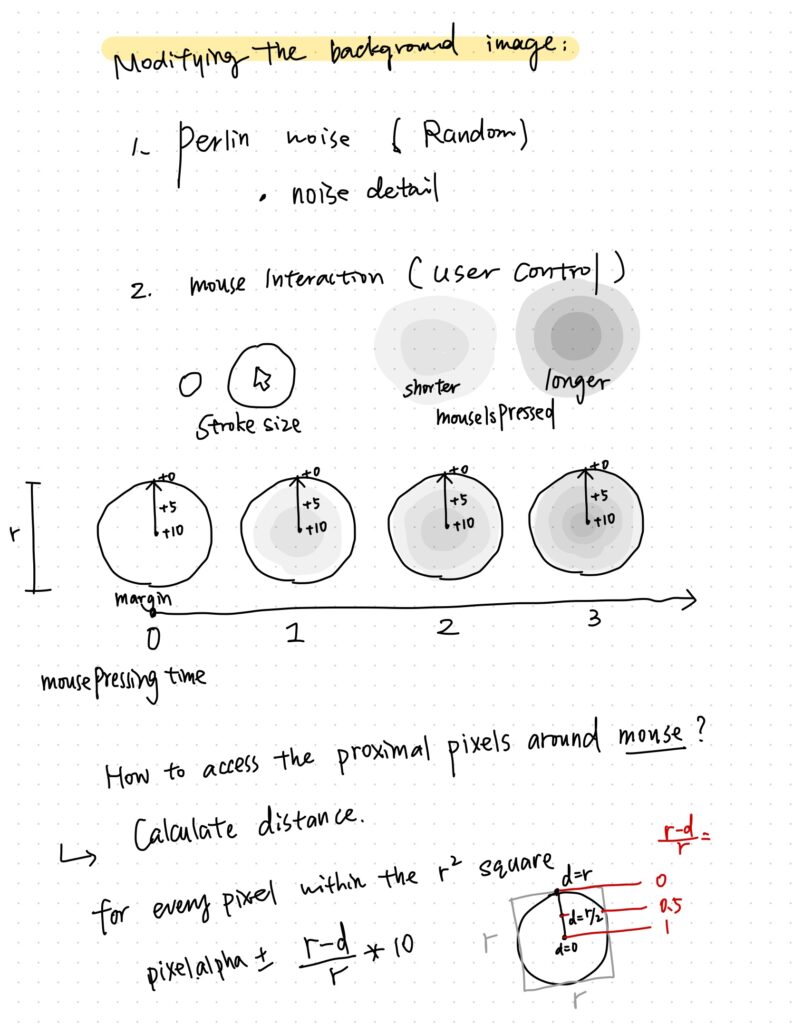
However, after discussing my SVG file code (the above embedded sketch) with professor Aya, we came to the conclusion that I can try to delete the perlin noise inside the circle while trying to maintain the other traces that perlin noise created for the lines, loops, ellipses, etc. For this I simply had to modify this snippet of code so that the below part is moved from function draw() to function setup():

background(0, 5); //the smaller the last number is, the longer the strokes stay visible + the slower the background color switches.

I also commented out the initial background drawing function I had in setup as well as the code that created the perlin noise pattern inside the circle:

//   // loop through each pixel inside the circle
//   for (let x = centerX - radius; x < centerX + radius; x++) {
//     for (let y = centerY - radius; y < centerY + radius; y++) {
//       let d = dist(x, y, centerX, centerY);

//       // check if the pixel = inside the circle
//       if (d < radius) {
//         // calculate Perlin noise value based on pixel's position
//         let noiseValue = noise(x * 0.01, y * 0.01);

//         // map the noise value to control the grayscale color
//         let gray = map(noiseValue, 0, 0.2, 50, 120);

//         stroke(gray); // stroke color
//         point(x, y); // draw a pixel at calculated position
//       }
//     }
//   }
  
  // noLoop(); // stop the draw loop after one frame
  //end of circle

After that, I modified the code so that both the “exploding” and “background flow field” ellipses will be smaller in quantity and size in hopes of decreasing the file size:

...

let particles1 = []; // exploding particles
let particles = []; // perlin noise flow field particles
const numParticles1 = 50; // exploding particles number
const numParticles = 500; // exploding particles number
const expansionLimit = 360; // Set your desired expansion limit

const num = 150; // flow field particles
const noiseScale = 0.01 / 2;
...

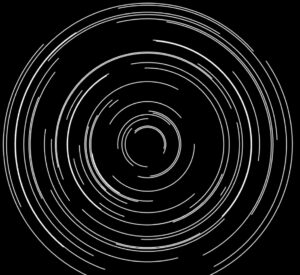
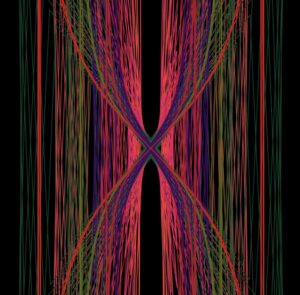
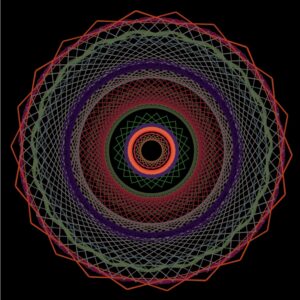
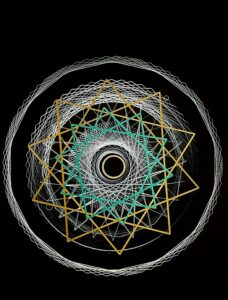
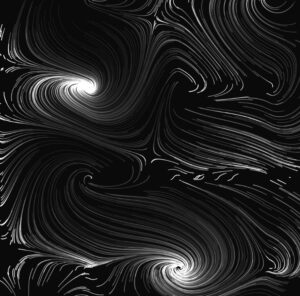
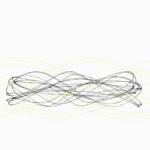
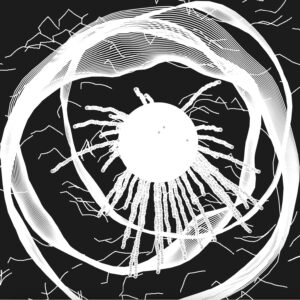
At this point, I had this sketch running that I was able to export into SVG successfully directly from p5.js!


This is also how it looked as an SVG file:

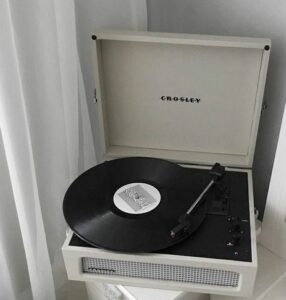
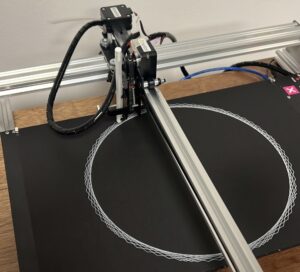
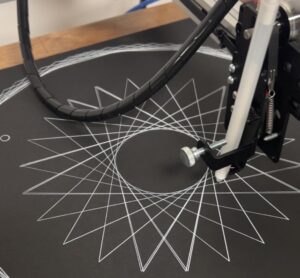
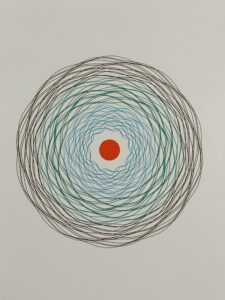
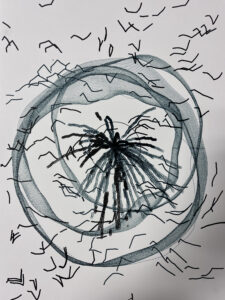
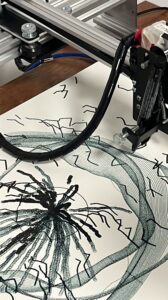
Although I had to make some adjustments, I was pretty happy with the amount of elements that I was able to keep. So afterwards, I set onto plotting my sketch on the pen plotter, which also took around two to three attempts because they kept stopping midway. Finally, for the last version, I decided to just try white paper and black pen because my sketch was pretty detailed and I didn’t want to risk eliminating those details using a white pen, which was less reliable compared to the black pens we had. It took way, way longer than I thought (two hours…), and I also had to change the pen midway because it ran out of ink, but it somehow worked and I’m very happy with the result:

Here’s a short clip of the printing process:

IMG_9857

…and the GoPro recording: GH010649

Evolution of my sketch:

I thought it’d be cool to list all the versions of the sketch that I made till my final product!

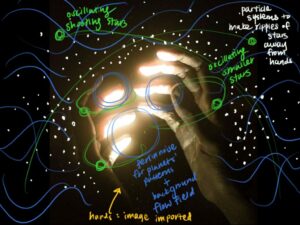
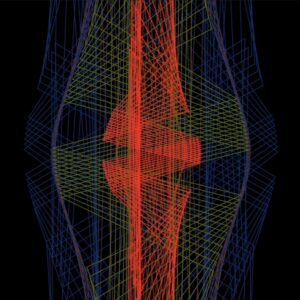
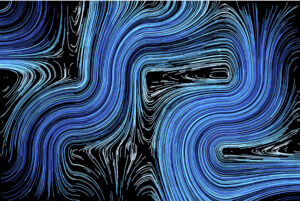
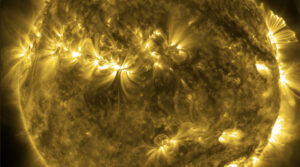
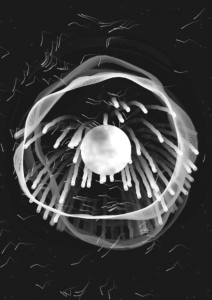
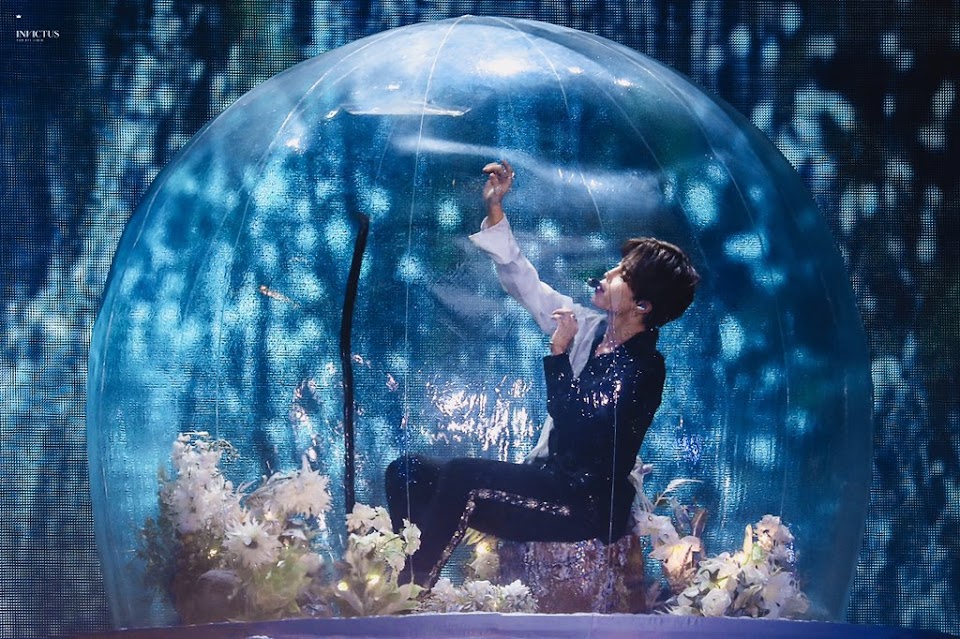
At first, I was leaning more towards the whole “universe in one’s palms” idea, hence the first sketch; however, after seeing this image from a performance, I kind of wanted to create a small “universe” that was kind of in a “bubble” with particle explosions and waves to showcase chaos that can be controlled yet randomized and unpredictable.

BTS's Jimin Reveals What Went Through His Head When The "Serendipity" Bubble Didn't Pop In Wembley, London - Koreaboo

These are also some research/videos that I referred to throughout my project:

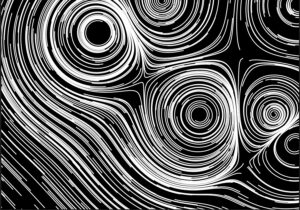
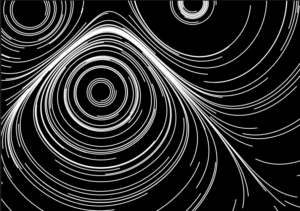
  • class PerlinShape — expanding circular waves; the patterns that a black hole generates (tutorial)
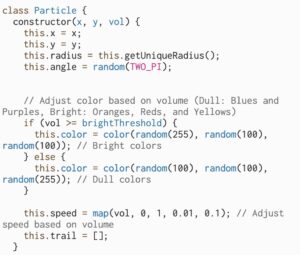
  • class particle — perlin noise flow field particles; symbolizes the small stars/shooting stars that we see passing by in the universe (tutorial)
  • class particle1 — explosion of particles; signifies big stars exploding/being generated in space (tutorial)
  • ellipse — has perlin noise pattern inside; the “moon”

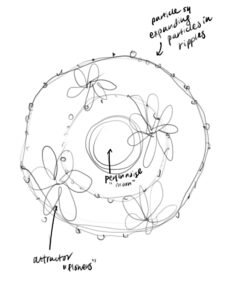
Once I had this basic outline of how I wanted my sketch to look like, I was able to apply skills that I learned in class for each of them:

  1. using perlin noise to create the surface of the planet (ellipse)
  2. particle systems to make an “ripple” explosion of particles from the ellipse
  3. using perlin noise to create a flow field for the background

2.

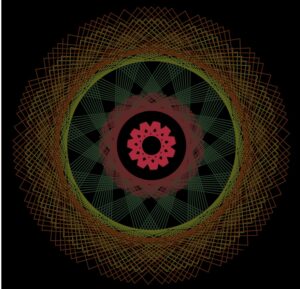
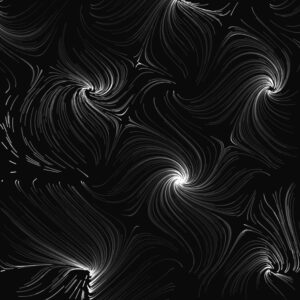
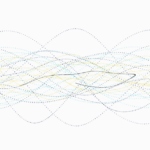
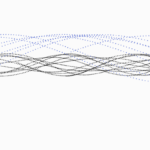
Then, I played around with the flow field and perlin noise as well as the direction change at mouse click.
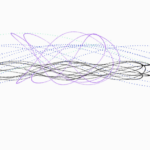
3.
This was when I started to form a general idea of what kind of elements I’d specifically need, what kind of final product I wanted to achieve, etc., and I added the exploding particles and perlin noise ellipse in the middle.
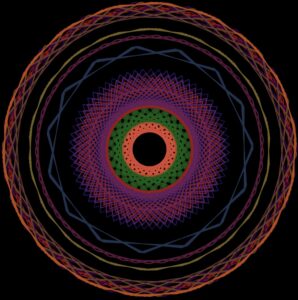
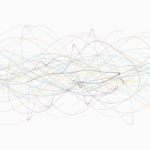
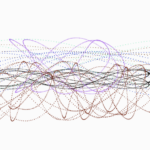
4.
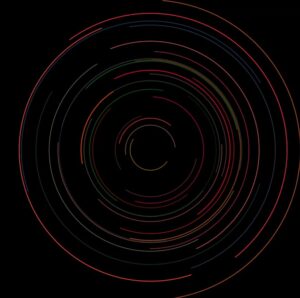
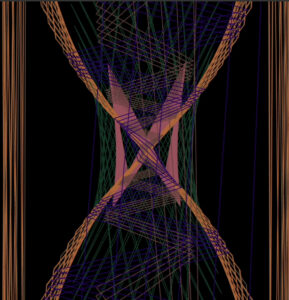
Then I began experimenting with combining perlin noise loop and the flow field background I already had, and although my initial idea was to only create one single line of perlin noise loop, I actually ended up liking this tracing of the loop that made it look like there’s multiple lines on canvas so I kept it.
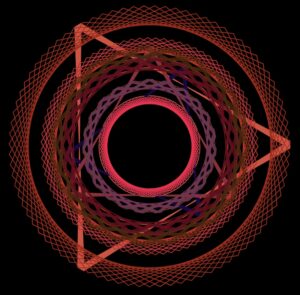
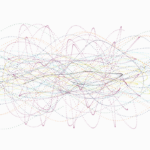
5.
Then I combined all elements together and modified some elements (expansion limit of exploding particles, how long the traces will remain on canvas, etc.) — almost there to the end sketch!

6.
Finally, this is the end result of my code, in which I simply added a hand image at the bottom of the canvas — my very first idea was to create a smaller universe within two pairs of hands, and although I gave up on the idea because I made many modifications to my sketch since then, I still wanted to try implementing an image to combine it with a randomly generated art sketch even if it was only for my code and not my SVG sketch.

Link to code: https://editor.p5js.org/Clara0424/sketches/FLpwKaMgl

Reflection:

Here are some complications that I thought were significant during my process of creating this final sketch. These struggles were all documented in my previous posts, but I just wanted to make a compilation of them in one post so that it’s easier for me to identify and present.

  1. Combining all elements (flow field background, perlin noise loops, perlin noise ellipse, exploding particles, hand image) and readjusting all of their positions. For example, readjusting my exploding particles to the center after adding the perlin noise loops took a long time for me to crack the code (used the code below to readjust the position).
let particle1 = new Particle1(width/2, height/2); // Set initial position of the explosion WITHIN the circle boundary
// Check if the particle has exceeded the expansion limit; controlling this elongates the ellipse boundary limit of the particles 
if (dist(this.position.x*1, this.position.y*1, width/2, height/2) >= this.expansionLimit) {
  this.lifespan = 0;
}
display() {
  fill(255, this.lifespan);
  ellipse(this.position.x*1, this.position.y*1, 10, 10); // the position of the ellipse limit itself
}

2. SVG export (as mentioned above in this post) — I had many alterations, sketches, and experiments with the original code till the point where I was confused about which version is what, haha. The printing process itself was also a challenge not just because of the long hours it took but also because of the sudden pauses that disrupted my sketch from being plotted in one go.

However, I also had parts of my process/code that I was proud of, such as:

  1. Using function mouseReleased() to reset the noise seed every time I release the mouse. By setting the noise seed to the current millisecond value, I was able to increase the randomization, variety, and designs of my sketch for all of my elements. The snippet of code I used for this is shown below:
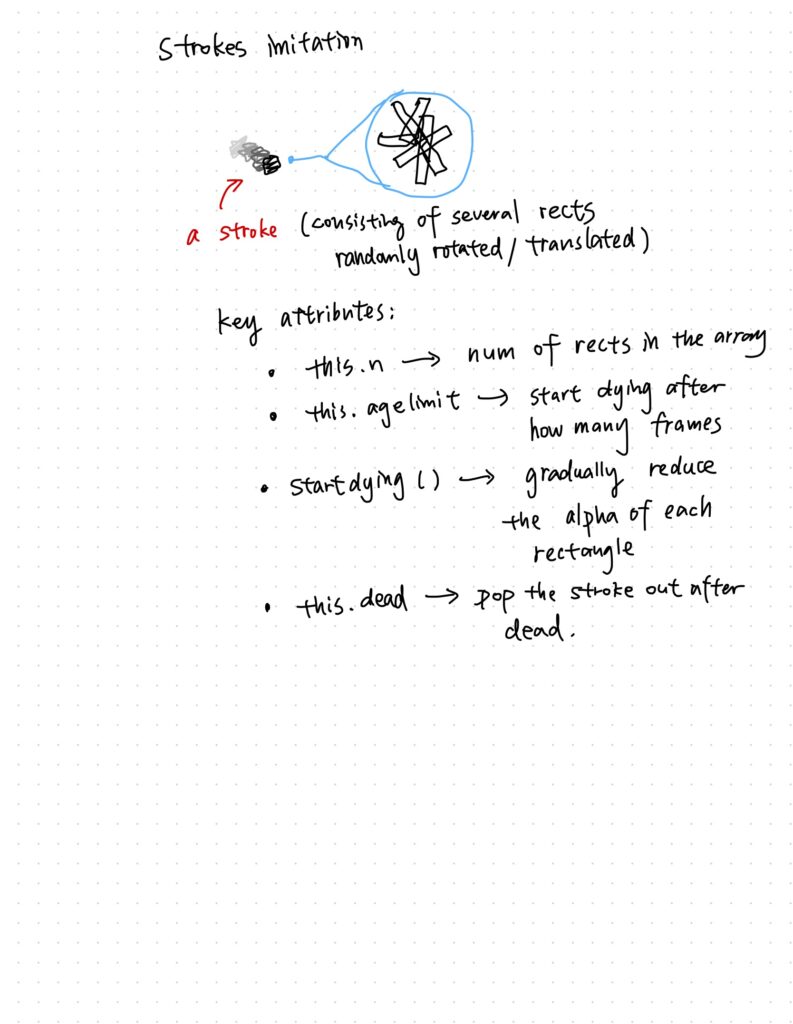
    function mouseReleased() {
      noiseSeed(millis());
    }

    2. Another element of my code that I’m particularly proud of is the PerlinShape.js class, which is the class that is responsible for generating the perlin noise loops in my sketch. Initially I didn’t expect there to be multiple loop lines, but although I implemented the code for just one loop it ended up generating multiple because of the perlin noise code that I already had in my sketch code. So it traced the movement of the loop, which gave this illusion that there’s multiple loops moving around fluidly. This look was something that I wanted to achieve but gave up on earlier on when I was brainstorming what to do for my project, so I was really happy to accidentally stumble upon it and create it for my final sketch.

Final Words:

As tedious, time-consuming, and challenging this project was, I genuinely learned so much about not just p5.js coding but also about pen plotters, creating an original work, and experimenting with randomization and rolling with the knowledge that you will likely discover something completely new and unexpected that might trigger your interest midway into the process of creating it, causing you to shift your whole idea for your project. As a planner who prefers knowing what my next steps will be, this was hard to accept at first, but by the end of the project, I ended up enjoying and even anticipating the new designs that I might end up with once I implemented the next snippet of my code. It was really rewarding to see your original creation come to life not just in p5.js but also on an actual paper! 🙂

Midterm Project – Sound-Wave Sculptor

Inspiration:

I find that using your voice to create art can be interpreted in many ways. Several people take their experiences and perhaps even struggles and use art to voice their opinions. So while thinking of this idea of using your voice to make art, I began to wonder whether I can design a program to make generative art by using human voice, literally rather than figuratively…

I was wondering whether similar programs have been built before when I stumbled upon an article by Japanese artist Ryoji Ikeda, known for his innovative and contemporary work in the fields of sound art. His project , cyclo.id, in particular, caught my eye. His program focuses on creating circular patterns by the audio’s phase and amplitude and displaying it graphically. 

However, I felt as if although the black and white combination really allows us the viewer to focus on the patterns, I personally think that a pop of color is much more fun! That when the idea of warm and cool colors came to my mind. I began to wonder, what if I could take the idea of generative audiovisual patterns, and associate this audio and specifically the volume level to cool and warm color shades. Here are a few pictures of contrasting warm and cool colors I looked at to gain inspiration for my color palette. 


Concept:

The SoundWave Constructor is a program that generates an interactive art piece that dynamically responds to audio input from the computer’s microphone every time the program is ran. Every time the user makes noise, the program stores the volume level, and also instantiates a particle every time through the Particle class. 

Interestingly, several of the components/attributes of the particle will directly depend on the volume level. For instance, the color of the particle and its trace will depend on whether the volume recorded at that second by p5 is higher or lower than the Threshold. The color of the instantiated particle would be closer to the warmer colors such as the reds, yellows and oranges when the volume recorded is higher than the threshold and closer to the cooler colors such as the blues, purples and greens when the volume recorded is lower than the threshold.

Other factors that depend on the volume include the speed of orbit and the radius of orbit of the particle, and the same idea applies as well, higher/lower volumes constitute to faster/slower speed and larger/smaller radius respectively. I will explain these methods and their implementations in depth in the Code section of this blog post.

How it Started:

The initial Idea I had in mind was creating almost a digital and audiovisual record player. The way I did that was through creating a very similar particle system and continuously instantiating ellipse particles that also left a trail. Follow along for short descriptions/displays of several programs I tried out before I got to the final program. 

At first, I mainly focused on the instantiation of particles from the particle system. Not focusing on colors, nor speeds, my program lacked a pop of color, but also lacked that generative and creative aspect. Here’s how it looked at that stage:

Next thing I worked on was making sure that based on the volume, the speed of the instantiated particle was determined, and the color as well. Higher volume, faster speed, and brighter colors, lower volume, slower speed, and more dull colors. Snippets of this code and further explanation will be included in the code section. 

Once I got the speed and color covered, I began to wonder how much more can I push the generative aspect of this program? I began to think of this especially because I noticed that the behavior of these particles are very predictable, and that defies the purpose of generative art! Thats when I began to wonder, how can I play around with trigonometric functions and audio input to make the art less predictable. 

I mainly used trig values to computer the vector’s x and y, and also as part of the particles speed. The way I got the sketches bellow was by randomly switching around the trig values, and also experimenting with rational functions to see the different patterns. Here were a few sketches .

Here are a few sketches I got after fully developing the program:

Tackling Challenges: 

The main challenges I faced included editing my code so that it can save an SVG file to be printed on the x, y plotter. At first the SVG would save however it would not open on inkscape. I kept trying various variations in order to get an SVG file that opens on inkscape, but most of them either ran errors or simply did not open. 

After following the exact steps on the powerpoint presentation, and revising the syntax for mouse pressed, in addition to trials and errors, I was able to capture an SVG file that looked exactly like my program, and also captured the several layers of the particles and their trails, which was ideal for the printing.

Other challenges I faced included trying to pick which trig value to use as a parameter for vectors’ x and y values, as well as the angle. Playing around with the different trig values gave me several types of patterns, and each combination of trig functions gave a completely different pattern all of which were generative and looked very interesting. It was very difficult to pick one specific pattern, but I found that the combination I used in my final code was very visually pleasing. 

To better visualize take a look at the various trig function and their graphs over their period:

One more challenge I faced is leaving the trail on the leading particle. I initially made the leading particle an ellipse, however, I reduced the ellipses size by giving it radius of zero in order to create an illusion of an invisible leading particle. To figure out how to leave the trace, I looked into the update method, and also the create vector method, and combined both to store into the trail history list. 

Snippets of Code:

Using Particle System:

The Particle class is responsible for the individual particles. Each particle is created with a unique radius and a random starting angle, which is then manipulated with other trig functions. The color of the particle is determined based on the volume of the microphone input, with brighter colors for higher volumes. The speed of the particle is also adjusted based on the volume. The position of the particle is updated in the update method, and the path is recorded in the trail array. The display method draws the trail and a very small ellipse, which does not show as its meant to lead the trail, at the current position of the particle.

The ParticleSystem class is responsible for handling a collection of particles. In the update method, it calculates the number of particles to add based on the microphone volume and creates new particles at the specified location. If the number of particles is more than a certain threshold, which is 50 particles, older particles are removed. The display method updates and displays each particle in the system.

Managing Path Direction Through Vectors:

 A vector v is created using createVector(this.x, this.y) and it represent the current position of the particle.The vector is then appended to the array this.trail to record the path of the particle. This trail array stores the positions of the particle over time, which later is used to draw the path.The display method of the Particle class uses the this.trail array to draw the path of the particle by connecting the recorded positions using vertex calls, creating a visual trail.

Trigonometric Functions Patterns:

In the update method, the particle’s new x and y coordinates are calculated using trigonometric functions cos and sin. These functions use the this.angle and the particle’s this.radius to get the new position. This.x is calculated as width / 2 + cos(this.angle) * this.radius, which moves the particle horizontally based on the cosine of the angle.this.y is calculated as height / 2 + sin(this.angle) * this.radius, which moves the particle vertically based on the sine of the angle.

FINAL Product:

Note: Please make sure to enable your mic and allow access to run the program using user audio, the link of the program is attached below.

https://editor.p5js.org/ea2749/full/VkTBdCFbK

Plotter Sketches:

Reflection and Areas of Improvement:

Creating this p5 program was a very enlightening and fun journey, I most importantly learned how to take the examples, and concepts learned in class and integrate them with one another to create a program  that makes generative art. What I enjoyed the most was really trying out all the variations of trig functions I could use to make different patterns, because it allowed me to really visualize how big of an impact switching trig functions can have on our parameters which was the speed and angle.


Although I am satisfied with how my program turned out, I really look forward to further advancing this code and improving certain aspects such as working with more complicated trig functions and visualizing other potential patters. Or perhaps having several different types of particles behave is various ways rather than just one particle in a particle system.


Midterm Final: Rising Tide of Change by Abdelrahman Mallasi

Concept

In today’s age, climate change remains one of our most pressing concerns, and our role as humans in this issue is undeniable. This generative art project aims to convey this message, highlighting our influence on our environment.

The dynamic waves in the visualization, expanding outwards when the mouse is pressed, are symbolic of the rising sea levels. According to NASA, sea level rise is mainly due to two factors related to global warming: from “melting ice sheets and glaciers, and the expansion of seawater as it warms.” The rise in sea levels is at an unprecedented scale. According to Climate.org, the average sea level has risen 8–9 inches since 1880, and it has more than doubled from 0.06 inches  per year throughout the previous century to 0.14 inches per year only from 2006–2015. Rising sea levels can damage important local structures like roads, bridges, and power plants.  Almost everything, from transportation to waste management, is at risk due to higher sea levels.


SATELLITE DATA: 1993-PRESENT
Data source: Satellite sea level observations.
Credit: NASA’s Goddard Space Flight Center

At the heart of the piece lies a yellow circle – the sun, representing hope and the promise of a new day. Placing the sun in the center implies that despite the dangers and challenges, there’s a core of hope and a chance for a new beginning. This balances the alarming nature of the design with optimism.

The colors of the waves transition from blue to green to brown, encompassing the elements of water, vegetation, and the desert, paying homage to the UAE’s natural landscapes as it hosts the 2023 COP convention. COP – or Conference of Parties- is an annual global conference under the United Nations that brings together nations to discuss and advance international responses to climate change.

The waves do not move in a smooth, organized, calm manner. Instead, they are overlapping, some have bigger amplitudes than others and their speed increases over time. This utilizes oscillations and creates a chaotic motion, representing the uncertain reality of climate change. Each time the sketch runs, the radius and the number of waves change. This variability represents the unpredictable and changing nature of our environment, highlighting that the state of our climate constantly evolves and adapts. I’ve also added a drag force to the wave to create a realistic undercurrent force.

In my opinion, the most important aspect of this piece is its interactivity. The fact that the user, through their control of the mouse, directly influences the expansion of the waves and the size of the sun highlights the significant role humans play in the climate crisis. Whether we’re causing the sea levels to rise or projecting more hope for the future, the power is quite literally in our hands. This concept is further reinforced with the text embedded within the sketch “The future is in your hands”, emphasizing that every action counts.

The design of this project was partly inspired by this animation by @mr_praline on Instagram.

Embedded Code

Link to Sketch

Pen Plotter

Highlight of Code

function setup() {
 ....
  // Define the start and end colors for the waves.
  let colorStart = color("#38A7DD");
  let colorEnd = color("#745807");

  // Loop to create individual wave objects and push them to the waves array.
  for (let i = 0; i < numWaves; i++) {
    // Get a value between 0 and 1, mapping the current wave number i
    let lerpAmt = map(i, 0, numWaves, 0, 1);

    // Interpolate between the start and end colors based on the mapped value.
    let waveColor = lerpColor(colorStart, colorEnd, lerpAmt);

    waves.push(new Wave(i,centerRadius + i * 5, i % 2 === 0 ? 0.01 : -0.01, i / 10, waveColor));
  }
}

I like how I used the lerpColor function to create a nice gradient between the colors of the waves. At first I defined a starting color and an ending color, then mapped the value of i (number of wave in the iteration which maps between 0 and total number of waves) to map between 0 and 1 and used that value in the lerpColor function.

I’m also proud of how I used the parameters of the wave function, especially the second and third parameters:

– centerRadius + i * 5: this sets the radius of the wave being slightly bigger than the previous one by an increment of 5 units.

– i % 2 === 0 ? 0.01 : -0.01: this is equivalent to the statement (if i %2===0, return 0.01, if not return -0.01). It checks if i is even or odd. Even values result in a direction of 0.01 and odd values give -0.01, ensuring alternating directions for waves.

Progress, Mess-Ups, and Challenges

In the first iterations of this project, the waves had a more uniform, predictable and smoother motion, with no sense of randomness. Since then, I’ve introduced an element of randomness and a more chaotic movement and a drag force, all to mimic the reality of climate change. Below is how it looked before.

I tried to make the sun and waves shrink id the mouse is released but it didn’t work out. I tried different versions but they all seemed to fail and I’m not sure how to fix it. The sketch below demonstrates the issue.

Manipulating and keeping track of all the different parameters in order to make the sketch’s animation flow seamlessly was one of the most challenging and confusing parts of this project.

Future Ideas

  • It could be cool if the waves and sun had a breathing effect
  • Introduce aquatic creatures as random walkers
  • I wanted the piece to reinforce its homage to the UAE. An idea is to outline UAE landmarks at the bottom of the sketch, perhaps the Burj Khalifa.
  • Emphasize the desert more by creating sand particles being blown off the dunes, maybe through the emitters we learned in Particle Systems

References

NASA article: https://climate.nasa.gov/vital-signs/sea-level/#:~:text=Global%20sea%20levels%20are%20rising,of%20seawater%20as%20it%20warms.

Climate.org: https://www.climate.gov/news-features/understanding-climate/climate-change-global-sea-level#:~:text=Global%20average%20sea%20level%20has,4%20inches)%20above%201993%20levels.

Midterm Progress #2 – Landscape

Concept:

My midterm project consists of a landscape NFT collection as a combination of my interest in cryptography and generative art. It uses different mathematical and artistic concepts to produce unique nature-related artwork. Through a GUI, the user can specify the style (acrylic, japanese, animated…) and generate their own NFT. As for choosing nature as a theme, I was inspired by the course’s name “decoding nature”.

Librairies/Algorithms:

TweakPane
Perlin Noise
Sin-Wave
Particle System
Recursion
Granulation
Linear Interpolation

Code: https://editor.p5js.org/bdr/sketches/qhH_1I3FP

Progress:

View post on imgur.com

View post on imgur.com

Code Walkthrough (Special Functions):

Vintage effect:
In order to get an ancient style, I’m using noise as a primary way to simulate the imperfections and irregularities alongside the random function. To generate the dots in the corner, I’m using the following:

function displayNoise(){
    strokeWeight(0.5);
    for(let dx = 0; dx < width; dx += random(1, 3)) {
        for(let dy = 0; dy < height; dy += random(1, 3)) {
        	let pointX = dx * noise(dy/10);
            let pointY = dy * noise(dx/10);
            if (get(pointX, pointY)[0]==241) {
                stroke(darkColor);
            } else {
                stroke(lightColor);
            }
        	point(pointX, pointY);
        }
    }
}

Mountains:
To create hand-drawn mountain contours, I’m using sin-waves relying on vertices, noise, and random functions. To get varying amplitudes I’m using the following:

let a = random(-width/2, width/2);
let b = random(-width/2, width/2);
let c = random(2, 4);
let d = random(40, 50);
let e = random(-width/2, width/2);

for (let x = 0; x < width; x ++){          
  	let y = currY[j];
  	y += 10*j*sin(2*dx/j + a);
  	y += c*j*sin(5*dx/j + b);
  	y += d*j*noise(1.2*dx/j +e);
  	y += 1.7*j*noise(10*dx);
    dx+=0.02;
    mountains.push({x,y})
}

As for the vertices and to be able to close the shape in order to be able to fill it later on, I’m using:

beginShape();
vertex(0, height);
for (let i = 0; i < mountains.length; i++) {
    stroke(darkColor);
    vertex(mountains[i].x, mountains[i].y);
}
vertex(width, height);
endShape(CLOSE);

Matrix Japanese Text:
The Japanese text represents different nature and life related quotes that are displayed vertically in a Matrix style. I’m thinking of animating it later.

["風流韻事" // Appreciating nature through elegant pursuits such as poetry, calligraphy and painting
,"柳は緑花は紅" // Willows are green, flowers are crimson; natural state, unspoiled by human touch, nature is beautiful, all things have different natures or characteristics.
,"花鳥風月" // The beauties of nature. 
,"旅はまだ途中だぞ" // Our adventure is not done yet
,"前向きにね" // Stay positive
,"雨降って地固まる" // After rain, comes fair weather
,"苦あれば楽あり" // There are hardships and also there are pleasures
,"初心忘るべからず" // Should not forget our original intention
,"浮世憂き世" // Floating world
,"自分の生きる人生を愛せ" // Love the life you are living
,"行雲流水" // Flow as the clouds and water
,"人生は夢だらけ" // Life is full of dreams
,"春になると森は青々としてくるです" // In spring, the forest becomes lush
,"今日の夕焼けはとてもきれいです" // Today's sky is nice and red
,"生き甲斐" // Realisation of what one expects and hopes for in life
];

Gradient:
To get a smooth gradient, I’m using the mathematical concept: linear interpolation. It constructs new data points within the range of a given discrete set data points which are in our case colors.

function applyGradient(x, y, w, h, color1, color2) {
   noFill();
   for (let i = y; i <= y + h; i++) {
      let mid = map(i, y, y + h, 0, 1);
      let clr = lerpColor(color1, color2, mid);
      stroke(clr);
      line(x, i, x + w, i);
   }
}

Granulation and Blur:
To do that, I looped over the canvas pixels and shifted some of them randomly. To further fuzzify the artwork, I rounded the pixels after moving them as well and getting their density.

function granulateFuzzify(amount) {
    loadPixels();
    let d = pixelDensity();
    let fuzzyPixels = 2;
    let modC = 4 * fuzzyPixels;
    let modW = 4 * width * d;
    let pixelsCount = modW * (height * d);
    for (let i = 0; i < pixelsCount; i += 4) {
        let f = modC + modW;
    		if (pixels[i+f]) {
            pixels[i] = round((pixels[i] + pixels[i+f])/2);
    			  pixels[i+1] = round((pixels[i+1] + pixels[i+f+1])/2);
    			  pixels[i+2] = round((pixels[i+2] + pixels[i+f+2])/2);
    		}
        pixels[i] = pixels[i] + random(-amount, amount);
        pixels[i+1] = pixels[i+1] + random(-amount, amount);
        pixels[i+2] = pixels[i+2] + random(-amount, amount);
    }
    updatePixels();
}

Stars Particle System:
To get a stars system, I had a separate class named Star and created new instances using a for loop.

class Star {
  constructor(x, y) {
    this.xPos = x;
    this.yPos = y;
  }

  draw() {
    let randSize = random(3);
    fill(255, 255, 255, random(0, 200));
    ellipse(this.xPos, this.yPos, randSize, randSize);
  }
}

function makeStars(numStars) {
  if (starCount < numStars) {
    let s = new Star(int(random(width)), int(random(height / 1.8)));
    s.draw();
  }
  starCount++;
}

Challenges:

One of the challenges I have faced is certainly setting the right parameters for the waves to get a somewhat hand-drawn but still realistic set of mountains. It took a lot of experimentation, trial and errors to finally find the right combination. Similarly, for the gradient to be smooth and match all the components of the artwork, I had to find the right settings for the linear interpolation.

Next Steps:

Animation: animate the canvas/artwork, most probably a 3D effect.

Midterm Project Progress 2 – Week 6

To begin working on my project I started off with a plan of what creatures I want to include in my underwater simulation. I decided on four creatures that belong to relatively different species: Starfish, Seahorses, Jellyfish, and Octopi.

My approach was to begin first by sketching out the shapes on the p5js canvas using the beginShape() and endShape() functions. I started off with the starfish which I sketched initially using polar coordinates of a circle. I introduced an inner radius, and outer radius, then had the ‘cos’ and ‘sin’ waves impact the angles of the coordinates of the curves that are drawn based on the two different radii. Putting all this in a loop that ran for a full circle ’TWO_PI’, and incremented its loops at a rate ‘PI/2.5’ I was able to achieve a star looking shape with 5 points.

  for (let angle = 0; angle <= TWO_PI; angle += PI/2.5) 
{
  let x = centerX + radius * cos(angle);
  let y = centerY + radius * sin(angle);
  curveVertex(x, y);
  let x2 = (centerX) + radius2 * cos(angle + HALF_PI / 2.5);
  let y2 = (centerY) + radius2 * sin(angle + HALF_PI / 2.5);
  curveVertex(x2, y2);
}
   endShape(CLOSE);
}

Moving on from there I began introducing noise to all the elements of the star, from its colors to its coordinates. I then also added the incremented I value at the beginning of the draw function to create the animated effect on the star.

let i = 0;
function draw()
{
  i++;
  let radius = 200 * noise(i / 300) + 100;
  let radius2 = 100 * noise(i / 150) + 50;
  let centerX = width / 2;
  let centerY = height / 2;
  translate(0, -40);
  for (let angle = 0; angle <= TWO_PI; angle += 100) 
  {
    background(0, 1);
    let noiseStrokeR = noise(angle);
    let noiseStrokeG = noise(i / 2);
    let noiseStrokeB = noise(angle, i / 2);
    stroke(
      Math.round(255 * noiseStrokeR + 10),
      Math.round(120 * noiseStrokeB + 40),
      Math.round(255 * noiseStrokeG),60
      );
      beginShape();
      fill(0,10)
      let noiseY = noise(radius / 1000) * 100;
      let noiseX = 20 - noise(angle, i / 2000) * 200;
    for (let angle = 0; angle <= TWO_PI; angle += PI/2.5) 
  {
    let x = centerX + radius * cos(angle);
    let y = centerY + radius * sin(angle) + (3.5 - noise((angle), i / 15) * 7);
    curveVertex(x + noiseX, y + noiseY);
    let x2 = (centerX) + radius2 * cos(angle + HALF_PI / 2.5);
    let y2 = (centerY) + radius2 * sin(angle + HALF_PI / 2.5);
    curveVertex(x2 + noiseX, y2 + noiseY);
  }
     endShape(CLOSE);
  }
}

For the trails left behind the star I worked with the alpha value of the stroke, and of the background that is drawn constantly through the draw() function.

Once I was somewhat satisfied with the look of the star I added it to a class so that I’d be able to introduce it at randomized amounts and positions on the canvas moving forward.

One thing I am also still working on as a development on the starFish class is introducing elements of motion to the object, so far I have added velocity, similar to how we’ve been doing so far with the movers, however I am yet to introduce an anti collision function to prevent my starfish from colliding.

class StarFish {
  constructor(x, y, dimensions, velocity) {
    this.i = 0;
    this.centerX = x;
    this.centerY = y;
    this.radius = dimensions;
    this.radius2 = dimensions / 2;
    this.velocity = velocity;
  }

  update(starFishes) {
    this.i++;
    this.radius = 200 * noise(this.i / 300) + 100;
    this.radius2 = 100 * noise(this.i / 150) + 50;
    this.centerX += this.velocity.x;
    this.centerY += this.velocity.y;

Another thing I want to develop on this class is have the movement appear a lot more organic, and perhaps have the stars rotate and not remain stable in angle to bring them to life. When noise was the only element effecting their animation they looked quite organic but they only seemed to vibrate in one position, that is why I felt the need to include motion, which, while allowing the star to move it seemed to give it a more unrealistic feel.

I believe that these issues could be resolved by adding forces working with acceleration and velocity at extremely low rates to mimic the movement of starfish.

My plan is to continue developing this class and then hopefully introducing its elements to the classes of the different creatures.

With the other three creatures, I have a plan on how I will execute them, in terms of sketching them, but so far, I only have the seahorse drawn using the beginShape() function. I have some concerns regarding how the seahorse is gonna come out, as well as the other creatures, mainly because I am not sure how much noise and to which parts of the drawing exactly could I include it. However, this of course will only be figured out with trial and error and trying different methods of approach just like I did with the starfish.

One other element I am hoping to be able to achieve but I am still unsure of how to execute is having the creatures morph or transform into one another. I don’t really have a plan of how to execute that but I am still looking into it.

During this process, I faced two main difficulties, first with the SVG file, which unfortunately I could not get no matter that different sketches I tried it with. I am not sure of whether the issue is in my methodology or my sketches themselves.

The second difficulty was in terms of the trail and the overall look of the star, I was hoping to draw it as a series of lines but I ended up with one continuous line. The reason I thought a series of line stemming from the center would work better is because I imagined a more organic look to appear through introducing noise to every single line. I wasn’t able to achieve that, unfortunately, however, I think what I have so far, for the star, looks relatively good.

Xiaozao Midterm Progress #2

Project title: Flowing Painting

The goal of my project is to create an animated version of the famous painting Starry Sky by Vincent van Gogh. These are the core logic of how I plan to achieve that:

As I mentioned last week, I found a way of creating the vortex movement pattern based on a 2D Perlin noise field. The logic is to generate a base image of the noise field, put it at the bottom of the canvas, and calculate the driving force using the “difference of pressure” around any pixel.

I tried with the vortex field and generated some images:

And then I tried with the 3d Perlin noise:

Eventually, I want to achieve two things:

The first one is to convert the painting Starry Sky into this kind of alpha terrain. The second is to allow users to build their own terrain (base image). I plan to work on this the next week! Here’s the plan:

Another thing that is important to animating the painting is to create “strokes” that look real, instead of the particles.

Here’s how I generate the strokes to make them more like the strokes in the painting:

Coding Assignment Week #6 – Midterm Project Preperation 2.0

Finalized Concept:

The main idea of my code is using user’s audio input to instantiate objects , which are these orbiting circles. Noise made by the user will instantiate objects of the particle class.  The more noise the user makes, the mic.getlevel function will record that volume, and objects of the particle class will be instantiated. Besides the particle system concept, I decided to also integrate the sin and cosine function that take in the angle as an input, which creates that curved path. The program to play different music/change colors and speeds based on the volume of the user’s audio. For instance: associating higher volumes, that is when mic.getlevel exceeds a certain threshold,  to brighter colors (oranges, yellows, reds), more high pitched music(guitar, bass, drums), and increasing the speed of the particles, while associating lower volumes ,that is when mic.getlevel is below a certain threshold,  to more dull colors (blue, purple, green), more low pitched music(piano, violin, harp), and decreasing the speed of the particles.

Progress from Last Week:

  • Implemented the getVolume and Threshold
  • Implemented the increase/descrease speed based on volume using map function
  • Associated certain colors to volumes by restricting the randomness in RGB values
  • Clearing/splicing elements from the particle system list when list gets too long
  • Implemented a list that stores radii that have already been used so particles instantiated dont overlap


SVG files:

I am currently having trouble downloading the zip files on my laptop, I booked office hours and will try to get help from my peers to hopefully resolve this issue. I was facing issues with the download which is also why I was not able to submit this on time, sorry for the inconvenience.

Program:


Midterm Progress #2

Concept:

I decided to alter my initial idea due to some issues. In order to achieve the desired effect, I needed to have hundreds of particles, and because they had to be aware of each other and interact among themselves, that required a lot of iterations which turned out to be too heavy on p5js and resulted in a lot of lagging. Thus, I decided that I still want to explore particles, and have a theme of emergence but not in an artificial life way, but more in a creating a pattern way.

To achieve this concept, I wanted to allow the particles to move independently and only be attracted or repelled in random areas. For this reason, I decided to create magnet objects, that would have a power coefficient of either 1 or -1 and would thus either attract or repel the particles respectively.  With such design, I have a lot of opportunities for generative art and customization, since a lot of components can be either randomized or granted control over for the user.

Here is my current sketch:

Next steps:

This version looks optimal for the pen plotter, however I still need to fix my SVG files. Since my lines are a bunch of dots, I need to convert them into curves or otherwise this will take forever for the pen plotter to draw. Regarding my sketch, I need to implement the different modes. I am thinking of introducing simple UI to allow the user to adjust the number of magnets, particles and colors of the sketch. This way I would have a high number of combinations a user can achieve with only 5 sliders(one for magnets, one for particles and 3 for color: red, green and blue). Below are a few versions of my sketch I was able to achieve by altering these components.

Midterm Progress 2

To recap, here’s a picture of an inspiration of what I wanted do for my midterm.

This is the mighty Sun. It’s a star in our solar system that is about 4.5 billion years of age. It’s mostly made up of Hydrogen (H), and Helium (He).

What we see on this picture is the surface of the star, up to the Photosphere. The two gases are interacting with each other and generating energy that sometimes, due to Sun’s strange magnetic fields, creates gaseous eruptions called the Solar Prominence.

I am using these concepts on my generative art revolving around the movements of gases, and creating eruptions. At first I was planning on using shaders, but then after a couple of articles and videos, I realized that it would take some time and expertise to learn GLSL. Therefore, I decided on using Perlin Noise along with Flow Fields, explained on a video by Daniel Shiffman.

I have utilized concepts learned in class such as Vectors, Forces, Oscillation, Sine Waves, and so on. This is how the sketch looks at the moment.

TODOs:

  1. Create the ring-shaped gaseous eruptions. (I’m very close)
  2. Clip the art onto a circle, to make it appear like a star.
  3. Add distant stars in the background. A for loop with vertices will do the trick.

Midterm Progress #2

Taking feedback from the presentation in class last time, I worked on 2 ideas this week to develop my midterm project.

IDEA #1

So, Inspired by the logarithmic spiral I discussed in the last post, I sketched a design I wanted to try implementing with p5. The design (sort of inspired by hena designs and sort of by fountains) can be found below:

I wanted each of these spirals to emerge from the center in sequencial order to create a performance of sorts – like in fountain or light shows.

I started by implementing just one spiral. The equation for a logarithmic spiral in polar coordinates is given by (where theta varies over time):

r = a * e ^ (theta * sin(b))

It took some playing around with the values of a, b, e to get results that matched my design. This is how it looked:

Then I started adding more than one spiral. I ran into problems here because I was trying to use the same a, e, b values for both while each updated separately, so it gave runtime errors. I then switched to creating classes for each of the spirals so it could have its own data members which could be updated independent of others.

After iterating through many intermediate process designs, I finally reached the desired output, yayy!

Version 1:

Version 2:

Version 3:

All thought I love this pattern, it is not really generative art. The full design of the performance is clearly thought out and coded to pan out like this only always. So, I will have to see what to do with this further and where to take it.

It did try to give it a bit of autonomy by randomising the direction change:

IDEA #2

Besides the above logarithmic pattern idea, I also used the last week to further build on my other idea of spirographs and somehow fuse all the designs together. Inspired by the feedback I got in class, I thought of implementing user interactivity to change parameters of the formula which are rendering such varied designs as shows last time. My idea was that each time user clicks on the screen, the values are randomly generated, to give me new design, with a new color, drawn on top of the previous one, hoping to create even more unique and wonderful patterns.

However, unfortunately, it turned out to be a #completefail :(( These idea and the patterns thus generated look so bad. It completely takes away from the aesthetics of the design and just looks like chaos. It does not seemingly fuse the designs at all as I had imagined. I will have to think of something else to do with this or a more unique and interesting way to get all of this together.

Here are a few pictures of the output:

Here is the sketch:

GOING FORWARD

So, the first idea has to be rejected because even though I am using randomness, I do not think it qualifies as generative art. Though I had a lot of fun experimenting with it! 🙂

I will work on the second idea but will not combine different shapes to be generated over each other. I am thinking of having one design itself and experiment with the parameters in it and give the user the choice of clicking on the screen to generate a new design (after wiping out the previous one). I just have to work further on the code to generate designs that really resonate with me. The idea and works are still developing and I would like feedback on this in class to work further.

UPDATE

Yay! So, while working further on our midterms in class, I discovered / generated this design! I absolutely love it and want to go ahead with this / finalize this as my midterm submission and the pen plotter design.

I love ghe above design, the dots have a sort of mystical effect to it. However, we cannot plot a million dots on the plotter so I will be changing the dots to lines using the concept of storing the previous position (x, y) of the dot and drawing a line between the previous and the current position each frame. It’s interesting how just changing from dots to lines, the feel of the design changes – this one is not mystical, rather bolder, more architectural and defined. I love this too! 😀

I also got feedback from the professor on the idea of the mouse click, though not needed, but is good to implement to show variation and the different designs that can be created. So, I will be working further on that. I am not sure how to apply a function (say sin, or cos, or tan) randomly to a value without hardcoding it. That is what I am currently trying to figure out and let’s see how it goes!