Sketch:
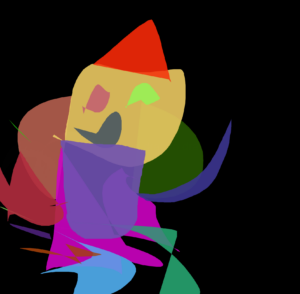
Example drawing
Concept Inspiration
My project was created with a focus on intersection of art and mathematics. I was particularly intrigued by the concept of Fourier transforms and their ability to break down complex patterns into simpler components. After seeing various implementations of Fourier drawings online, I was inspired to create my own version with a unique twist. I wanted to not only recreate drawings using Fourier series but also add an interactive coloring feature that would make the final result more visually appealing and engaging for users.
Process of Development
I began by following the Coding Train tutorial on Fourier transforms to implement the basic drawing and reconstruction functionality. This gave me a solid foundation to build upon. Once I had the core Fourier drawing working, I shifted my focus to developing the coloring aspect, which became my main contribution to the project.
The development process was iterative. I started with a simple algorithm to detect different sections of the drawing and then refined it over time. I experimented with various thresholds for determining when one section ends and another begins and worked on methods to close gaps between sections that should be connected. Even now, it is far from perfect but it does what I initially intended to.
How It Works
The application works in several stages:
- User Input: Users draw on a canvas using their mouse or touchscreen.
- Fourier Transform: The drawing is converted into a series of complex numbers and then transformed into the frequency domain using the Discrete Fourier Transform (DFT) algorithm. This part is largely based on the Coding Train tutorial.
- Drawing Reconstruction: The Fourier coefficients are used to recreate the drawing using a series of rotating circles (epicycles). The sum of all these rotations traces out a path that approximates the original drawing.
- Section Detection: My algorithm analyzes the original drawing to identify distinct sections based on the user’s drawing motion.
- Coloring: Each detected section is assigned a random color.
- Visualization: The reconstructed drawing is displayed, with each section filled in with its assigned color.
- Re: User is able to start the process again and creature unique coloring look.
- Save: User is able to save the image to their local machine.
Code I’m Proud Of
While the Fourier transform implementation was based on the tutorial, I’m particularly proud of the section detection and coloring algorithm I developed:
function detectSections(points) {
  let sections = [];
  let currentSection = [];
  let lastPoint = null;
  const distanceThreshold = 20;

  // Iterate over each point in the drawing
  for (let point of points) {
    if (lastPoint && dist(point.x, point.y, lastPoint.x, lastPoint.y) > distanceThreshold) {
      // If the distance between the current point and the last point exceeds the threshold,
      // consider it a new section and push the current section to the sections array
      if (currentSection.length > 0) {
        sections.push(currentSection);
        currentSection = [];
      }
    }
    // Add the current point to the current section
    currentSection.push(point);
    lastPoint = point;
  }

  // Push the last section to the sections array
  if (currentSection.length > 0) {
    sections.push(currentSection);
  }

  // Close gaps between sections by merging nearby sections
  return closeGapsBetweenSections(sections, distanceThreshold * 2);
}

function closeGapsBetweenSections(sections, maxGapSize) {
  let mergedSections = [];
  let currentMergedSection = sections[0];

  // Iterate over each section starting from the second section
  for (let i = 1; i < sections.length; i++) {
    let lastPoint = currentMergedSection[currentMergedSection.length - 1];
    let firstPointNextSection = sections[i][0];

    if (dist(lastPoint.x, lastPoint.y, firstPointNextSection.x, firstPointNextSection.y) <= maxGapSize) {
      // If the distance between the last point of the current merged section and the first point of the next section
      // is within the maxGapSize, merge the next section into the current merged section
      currentMergedSection = currentMergedSection.concat(sections[i]);
    } else {
      // If the distance exceeds the maxGapSize, push the current merged section to the mergedSections array
      // and start a new merged section with the next section
      mergedSections.push(currentMergedSection);
      currentMergedSection = sections[i];
    }
  }

  // Push the last merged section to the mergedSections array
  mergedSections.push(currentMergedSection);
  return mergedSections;
}
This algorithm detects separate sections in the drawing based on the distance between points, allowing for intuitive color separation. It also includes a method to close gaps between sections that are likely part of the same continuous line, which helps create more coherent colored areas.
Challenges
The main challenge I faced was implementing the coloring feature effectively. Determining where one section of the drawing ends and another begins was not straightforward, especially for complex drawings with overlapping lines or varying drawing speeds. I had to experiment with different distance thresholds to strike a balance between oversegmentation (too many small colored sections) and undersegmentation (not enough color variation).
Another challenge was ensuring that the coloring didn’t interfere with the Fourier reconstruction process. I needed to make sure that the section detection and coloring were applied to the original drawing data in a way that could be mapped onto the reconstructed Fourier drawing.
Reflection
This project was a valuable learning experience. It helped me understand how to apply mathematical concepts like Fourier transforms to create something visually interesting and interactive. While the core Fourier transform implementation was based on the tutorial, developing the coloring feature pushed me to think creatively about how to analyze and segment a drawing. Nevertheless, following tutorial also helped me comprehend mathematical side of the concept.
I gained insights into image processing techniques, particularly in terms of detecting continuity and breaks in line drawings. The project also improved my skills in working with canvas graphics and animation in JavaScript.
Moreover, this project taught me the importance of user experience in mathematical visualizations. Adding the coloring feature made the Fourier drawing process more engaging and accessible to users who might not be as interested in the underlying mathematics.
Future Improvements
Looking ahead, there are several ways I could enhance this project:
- User-defined Colors: Allow users to choose their own colors for sections instead of using random colors.
- Improved Section Detection: Implement more sophisticated algorithms for detecting drawing sections, possibly using machine learning techniques to better understand the user’s intent.
- Smooth Color Transitions: Add an option for smooth color gradients between sections instead of solid colors.
- Interactivity: Allow users to manipulate the colored sections after the drawing is complete, perhaps by dragging section boundaries or merging/splitting sections.
- Improved interface: make interface look more modern and polished.
References
- The Coding Train’s Fourier Transform tutorial by Daniel Shiffman
- P5.js documentation and examples
- Various online sources