Concept:
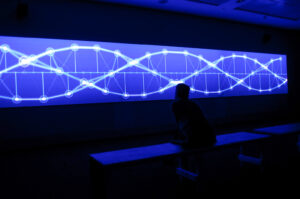
This week, we were tasked with gathering inspiration from Memo Akten’s work, focusing on visualizing simple harmonic motion (SHM). When I looked through his work I was reminded of the structure of DNA, with its two intertwining sine waves resembling the periodic motion characteristic of SHM. So, for my assignment I wanted to replicate that and try to mimic the movement and design of a DNA structure.
Key Features:
- Sine Waves as DNA Backbones: Two sinusoidal waves form the backbone of the DNA structure. These waves oscillate vertically and reflect the nature of simple harmonic motion.
- Bunched Particles: Along both sine waves, I added clusters of red particles to mimic the molecular bonds on a DNA strand, creating a more organic and dynamic feel.
- Colorful Connecting Rungs: The colorful “rungs” between the two sine waves change color as they move along the structure, representing the diversity and vibrancy found in DNA.
- 3D Rotation: The entire DNA strand rotates around the y-axis, adding a three-dimensional element to the animation.
embedded sketch:
Code I’m Most Proud Of:
I’m particularly proud of the code that generates the particles along the sine waves and the rungs. By combining randomness and structured positions, I was able to create visually interesting clusters that closely mimic the complexity of a DNA strand. Additionally, the color transitions in the connecting rungs add an appealing vibrancy to the piece, making it more engaging to look at.
// Function to draw bunched-up red particles along the sine waves
function drawParticles(x, y) {
  noStroke();
  fill(255, 0, 0);  // Red particles
  let numParticles = 5;  // Number of particles in each bunch
  let particleSize = 4;  // Size of each particle
  let spread = 5;  // Spread between particles in a bunch

  for (let i = 0; i < numParticles; i++) {
    // Create small offsets for the particles to make them appear bunched
    let offsetX = random(-spread, spread);
    let offsetY = random(-spread, spread);

    // Draw particle at each offset position
    ellipse(x + offsetX, y + offsetY, particleSize, particleSize);
  }
}

// Function to draw particles along the connecting strands (rungs)
function drawRungParticles(x1, x2, y) {
  noStroke();
  fill(0, 255, 0);  // Green particles for the connecting rungs
  let numRungParticles = 4;  // Number of particles along each rung
  let particleSize = 4;  // Size of each particle

  for (let i = 0; i < numRungParticles; i++) {
    // Calculate positions along the line between x1 and x2
    let t = i / (numRungParticles - 1);  // Normalize t to range [0, 1]
    let x = lerp(x1, x2, t);  // Linear interpolation between x1 and x2

    // Draw particle along the line connecting x1 and x2 (rung)
    ellipse(x, y, particleSize, particleSize);
  }
}
main functions:
drawParticles():- Red Particles: Randomly places red particles along each sine wave.
- Bunching: The function creates clusters of particles by adding random offsets (
offsetX,offsetY) to the position. This simulates the bunched look of molecules along DNA strands.
drawRungParticles():- Green Particles: Particles along the rungs (the connections between the two sine waves).
- Structured Positions: The function calculates positions between the two sine waves using linear interpolation (
lerp()), ensuring that the particles are evenly distributed along the connecting lines.
Reflections for Future Work:
In the future, I’d like to explore further how I can simulate more biological properties in this visualization. One idea is to add more complexity to the particles, making them behave like molecules interacting with one another. I also think it would be interesting to explore interactivity, where users can manipulate the DNA strand’s rotation, zoom, or even the particle behavior, allowing for a more immersive experience.