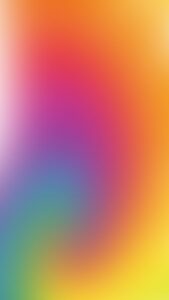
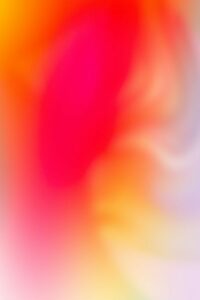
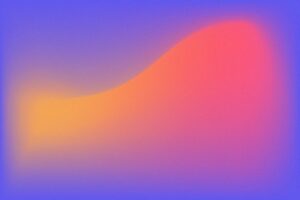
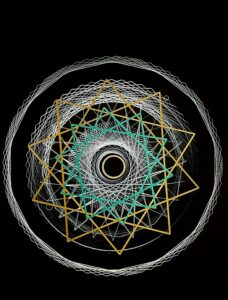
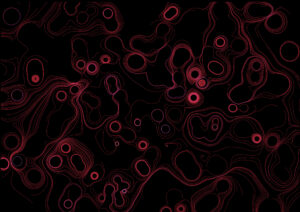
My midterm project consists of a landscape NFT collection as a combination of my interest in cryptography and generative art. It uses different mathematical and artistic concepts to produce unique nature-related artwork.
Think of NFTs as digital collectibles, like trading cards or unique stamps. When an artist creates a digital artwork, they can “mint” an NFT, which essentially means they create a special, one-of-a-kind digital token associated with that artwork.
In my project, through a GUI, the user can specify the style (acrylic, japanese, animated…) and mint their own NFT. The revolving theme is Nature, as I was inspired by the course’s name “decoding nature”.
For a better experience (Full Screen), use the following link.
Code Walkthrough (Special Functions):
Vintage effect:
In order to get an ancient style, I’m using noise as a primary way to simulate the imperfections and irregularities alongside the random function. i.e. most shapes have irregular edges, cracks, and distortions.
To generate the dots in the corner, I’m using the following:
function displayNoise(){
    strokeWeight(0.5);
    for(let dx = 0; dx < width; dx += random(1, 3)) {
        for(let dy = 0; dy < height; dy += random(1, 3)) {
            let pointX = dx * noise(dy/10);
            let pointY = dy * noise(dx/10);
            if (get(pointX, pointY)[0]==241) {
                stroke(darkColor);
            } else {
                stroke(lightColor);
            }
            point(pointX, pointY);
        }
    }
}
Hand-drawn effect:
To create hand-drawn contours, I’m using sin-waves relying on vertices, noise, and random functions. To get varying amplitudes I’m using the following:
let a = random(-width/2, width/2);
let b = random(-width/2, width/2);
let c = random(2, 4);
let d = random(40, 50);
let e = random(-width/2, width/2);
for (let x = 0; x < width; x ++){
      let y = currY[j];
      y += 10*j*sin(2*dx/j + a);
      y += c*j*sin(5*dx/j + b);
      y += d*j*noise(1.2*dx/j +e);
      y += 1.7*j*noise(10*dx);
    dx+=0.02;
    mountains.push({x,y})
}
As for the vertices and to be able to close the shape in order to be able to fill it later on, I’m using:
beginShape();
vertex(0, height);
for (let i = 0; i < mountains.length; i++) {
    stroke(darkColor);
    vertex(mountains[i].x, mountains[i].y);
}
vertex(width, height);
endShape(CLOSE);
Gradient:
To get a smooth gradient, I’m using the mathematical concept: linear interpolation.
It constructs new data points within the range of a given discrete set data points which are in our case colors.
function applyGradient(x, y, w, h, color1, color2) {
   noFill();
   for (let i = y; i <= y + h; i++) {
      let mid = map(i, y, y + h, 0, 1);
      let clr = lerpColor(color1, color2, mid);
      stroke(clr);
      line(x, i, x + w, i);
   }
}
Granulation and Blur:
To do that, I looped over the canvas pixels and shifted some of them randomly. To further fuzzify the artwork, I rounded the pixels after moving them as well and getting their density.
function granulateFuzzify(amount) {
    loadPixels();
    let d = pixelDensity();
    let fuzzyPixels = 2;
    let modC = 4 * fuzzyPixels;
    let modW = 4 * width * d;
    let pixelsCount = modW * (height * d);
    for (let i = 0; i < pixelsCount; i += 4) {
        let f = modC + modW;
            if (pixels[i+f]) {
            pixels[i] = round((pixels[i] + pixels[i+f])/2);
                  pixels[i+1] = round((pixels[i+1] + pixels[i+f+1])/2);
                  pixels[i+2] = round((pixels[i+2] + pixels[i+f+2])/2);
            }
        pixels[i] = pixels[i] + random(-amount, amount);
        pixels[i+1] = pixels[i+1] + random(-amount, amount);
        pixels[i+2] = pixels[i+2] + random(-amount, amount);
    }
    updatePixels();
}
Branches generation:
To display realistic branches, I’m alternating the size after each iteration. The branch is drawn using a sequence of circles. I’m using a seed variable called “BranchChance” to add randomness.
Noise Gradient background:
To set a sunset gradient for the canvas with some noise, I’m using ellipses once again as per the following:
function animateSunset(){
  clear();
  let cells = 128;
  let sat = 255;
  let bri = 192;
  let maxNoiseScale = 14;
  let p = 8;
  let cell = width / cells;

  randomSeed(0);

  z2 += 0.001;
  xoffset += 0.001;

  let noisePower = Math.pow(10, Math.log10(maxNoiseScale) / cells);

  let passes = 1;
  for (let z = 1; z <= passes; z++) {
    let cols = cells;
    let rows = cells;
    let noiseScale = noisePower;

    for (let j = -2; j < rows + 15; j++) {
      let y = (j / rows);
      let wy = y * height;

      for (let i = -2; i < cols + 8; i++) {
        let x = (i / cols);
        let wx = x * width;

        // Color
        let q = noise((x * noiseScale) + xoffset, y * noiseScale, z2);
        if (q > 0.5) {
          q = (((Math.pow(((q - 0.5) * 2) - 1, p) - 1) * -1) / 2) + 0.5;
        }
        else {
          q = Math.pow(q * 2, p) / 2;
        }
        q = ((q * 150) + 145) % 255;
        let boxColor = color(q, sat, bri, random(11) + 1);
        fill(boxColor);

        // Draw circle
        let factor = noise(x + xoffset, y, z2) * 23 + 1;
        let diameter = cell * factor;
        ellipse(wx, wy, diameter, diameter);
      }
      noiseScale *= noisePower;
    }
  }
}
Matrix Japanese Text:
The Japanese text represents different nature and life-related quotes that are displayed vertically in a Matrix style. I’m thinking of animating it later.
["風流韻事" // Appreciating nature through elegant pursuits such as poetry, calligraphy and painting
,"柳は緑花は紅" // Willows are green, flowers are crimson; natural state, unspoiled by human touch, nature is beautiful, all things have different natures or characteristics.
,"花鳥風月" // The beauties of nature.
,"旅はまだ途中だぞ" // Our adventure is not done yet
,"前向きにね" // Stay positive
,"雨降って地固まる" // After rain, comes fair weather
,"苦あれば楽あり" // There are hardships and also there are pleasures
,"初心忘るべからず" // Should not forget our original intention
,"浮世憂き世" // Floating world
,"自分の生きる人生を愛せ" // Love the life you are living
,"行雲流水" // Flow as the clouds and water
,"人生は夢だらけ" // Life is full of dreams
,"春になると森は青々としてくるです" // In spring, the forest becomes lush
,"今日の夕焼けはとてもきれいです" // Today's sky is nice and red
,"生き甲斐" // Realisation of what one expects and hopes for in life
];
Challenges:
One of the challenges I have faced is certainly setting the right parameters for the waves to get a somewhat hand-drawn but still realistic set of mountains. It took a lot of experimentation, trial and errors to finally find the right combination. Similarly, for both the gradients to be smooth and match all the components of the artwork, I had to find the right settings for the linear interpolation.
Future Plans:
Incorporate 3D elements using WebGL or other 3D engines.
Allow more customization through the GUI.
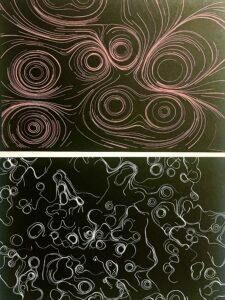
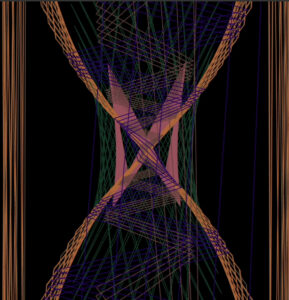
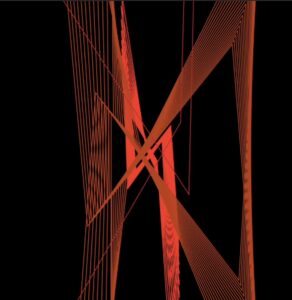
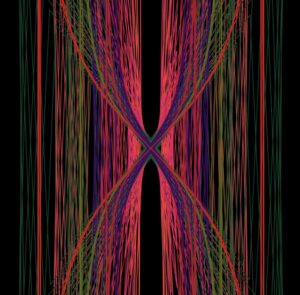
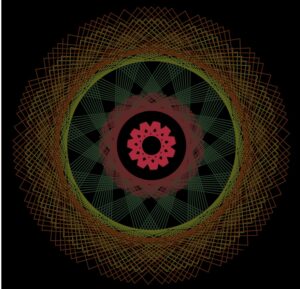
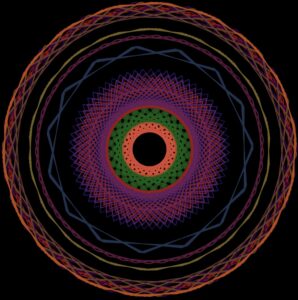
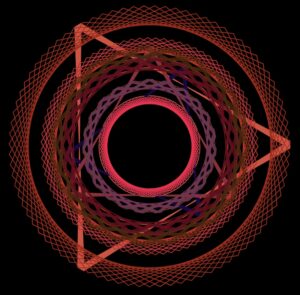
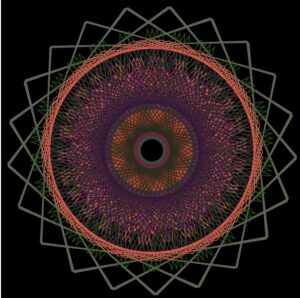
Below are the various different outputs I got from my above sketch:
CONCEPT, INSPIRATION & ARTISTIC VISION
How fascinating would it be to be able to visualize complex math equations into an easy-to-look generative design pattern? Fascinating no!
Math is everywhere around us, in the simplest to most complex of the things, but we don’t always necessarily see it as math. For this midterm project, I wanted to explore mathematical equations and find a way to visualize them using generative art and give them a visible form. But which equation? Or multiple equations? How do I choose?
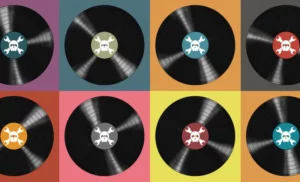
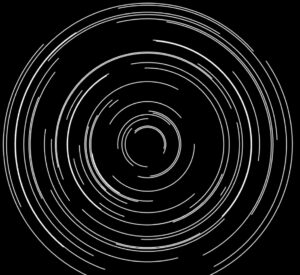
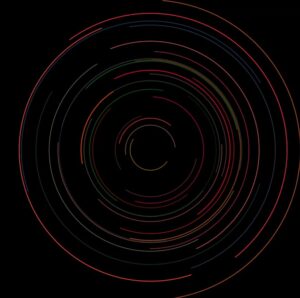
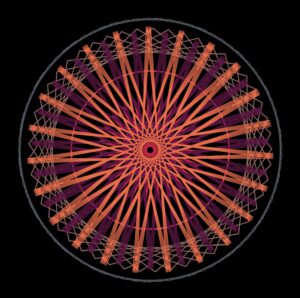
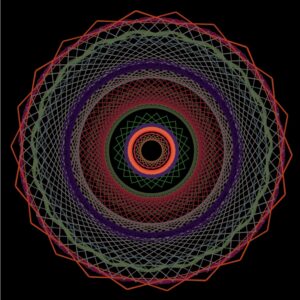
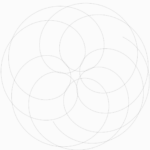
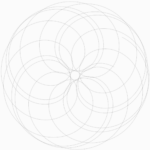
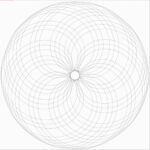
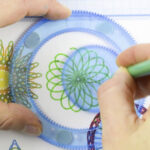
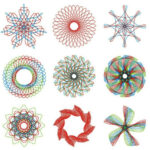
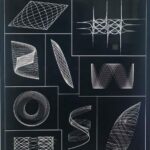
As a child, I most fondly played with the spirograph set (see pictures below). I would love to draw new designs and patterns through it. Different stencils and position of the pen give different designs.
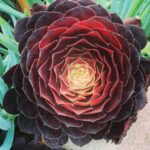
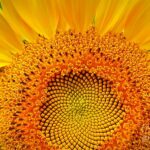
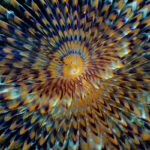
Some spirographs in nature:
Did you know there are actual math equations that trace the path / locus of these designs? For this project, I wanted to explore the math behind this concept and make generative art within this constraint. Can one equation by itself give rise to multiple varied distinguished designs? What are the the parameters of the equation which give it a certain characteristic? How does changing these parameters affect the design and feel of it?
I did some background research on mathematical equations and spirographs. This website explains the generation of spirographs and the equation behind it in simple terms. I carefully followed and read this as I evolved my idea, tried to code the designs and understood the math behind the visuals I was getting.
THE PROCESS
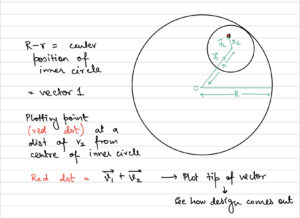
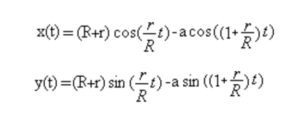
I started by understanding the physics behind the Spirographs and how they work. So it is essentially a circle within a circle with a point somewhere not in the centre in which you place your pen to create the designs. So I tried to model this using the physics concepts of vectors, position, their rectangular components, oscillation, sine and cosine, we learnt in class.
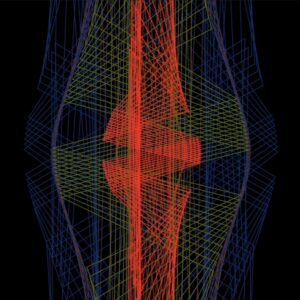
This was my starting sketch:
Based on some initial calculations that I did:
Here is the code snippet for it which exemplifies this vector behaviour:
translate(width/2, height/2);
circle(0, 0, R); // draw outer bigger circle
center = createVector((R/2-r/2)*cos(angle), (R/2-r/2)*sin(angle)); // center of the inner circle based on my calculations
circle(center.x, center.y, r); // draw inner circle
circle(center.x + r/2*cos(-1*angle), center.y + r/2*sin(-1*angle), 5); // draw the point of drawing --> currently at the boundary of inner circle
angle += 0.1; // increment angle each frame
The above behaviour achieved by simple physics and vectors has the following equation (this I derived myself, but can also be found online):
Going further, I realised it might be easier to get the equation version of the vector’s x and y position to plot it. How will this help? This will help in changing the shapes from circle to say ellipse, hyperbola or from changing the position of the smaller circle to be inside or outside, which would generate interesting and non-generic patterns. This is the time to be creative now!
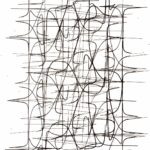
I experimented with the different parameters like the R, r, t (= angle), and even the functions of sine, cosine, tan, and function enclosed function, along with the changing the sign / direction of vector addition / subtraction to generate different designs.
It is important to note that I did not have a design in mind that I found the code for. Rather, I took a basic math structure (the base formula) and altered and experimented with it. I wanted to see how far the equation can be taken, pushed beyond its limits, and by changing some of it parameters and characteristics (while keeping basic skeleton of the equation as it is), can we generate complex designs which are completely unexpected for its behaviour? And yes, that happened! I kept on experimenting with the values and functions until I found designs and patterns that I really liked and resonated with me. That is the part of the code I am proud of 🙂
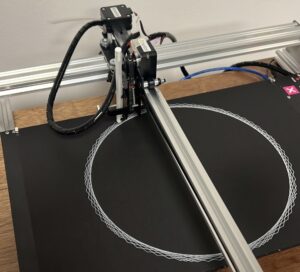
PEN PLOTTING PROCESS
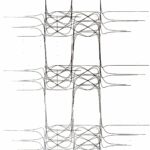
The pen plotting process was an absolutely fun process. I spent hours besides the plotter seeing my designs take form, changing the pen, putting the paper, changing the GoPro battery xD. Completely involved and engaged, I actually plotted 4 of my designs on the plotter and also prepared a matrix of some of my other designs also to be plotted.
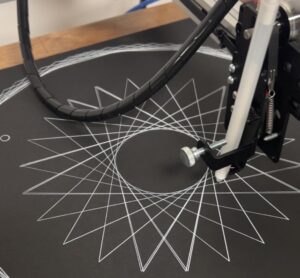
Here is the outcome of my designs:
I had to change my code from plotting dots to lines for the pen plotter since we cannot plot a million dots on the plotter. I did this by using the concept of storing the previous position (x, y) of the dot and drawing a line between the previous and the current position each frame.
Here is the code for it:
draw() {
    this.calculate();
    if (dist(this.x, this.y, this.prevX, this.prevY) > width/4) {
      this.prevX = this.x;
      this.prevY = this.y;
    }
    stroke(0,50);
    // point(this.x, this.y); // initially I was just plotting a point at the current x and y
    line(this.x, this.y, this.prevX, this.prevY); // now plotting a line between previous (x, y) and current (x, y)
    this.prevX = this.x;
    this.prevY = this.y;
    this.angle += 0.02;
  }
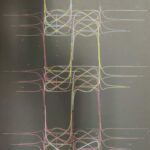
There is not much difference in the code per say, but the effect and feel of the design definitely changed. I like both the versions! 🙂
Hence, I decided to randomise dots versus dashes in the final sketch.
A peak into the working of the plotter:
FURTHER DEVELOPMENT
I am very happy and excited with outcome of my project and now want to go ahead and look into other mathematical equations. Find other things in nature taht fascinate me, pick a different equation and yallah experiment with it! The golden ratio has often intrigued me and other equations like the logarithmic and archemedian spirals also have a lot to contribute to the field of design. I think I might pick a couple of equations together, nit just one and superimpose those like we did with the sin waves in class. It’ll be interesting to see how other math equations behave and if the output we get is varied / distinct or actually we can generate similar patterns using other defining physical constraints?
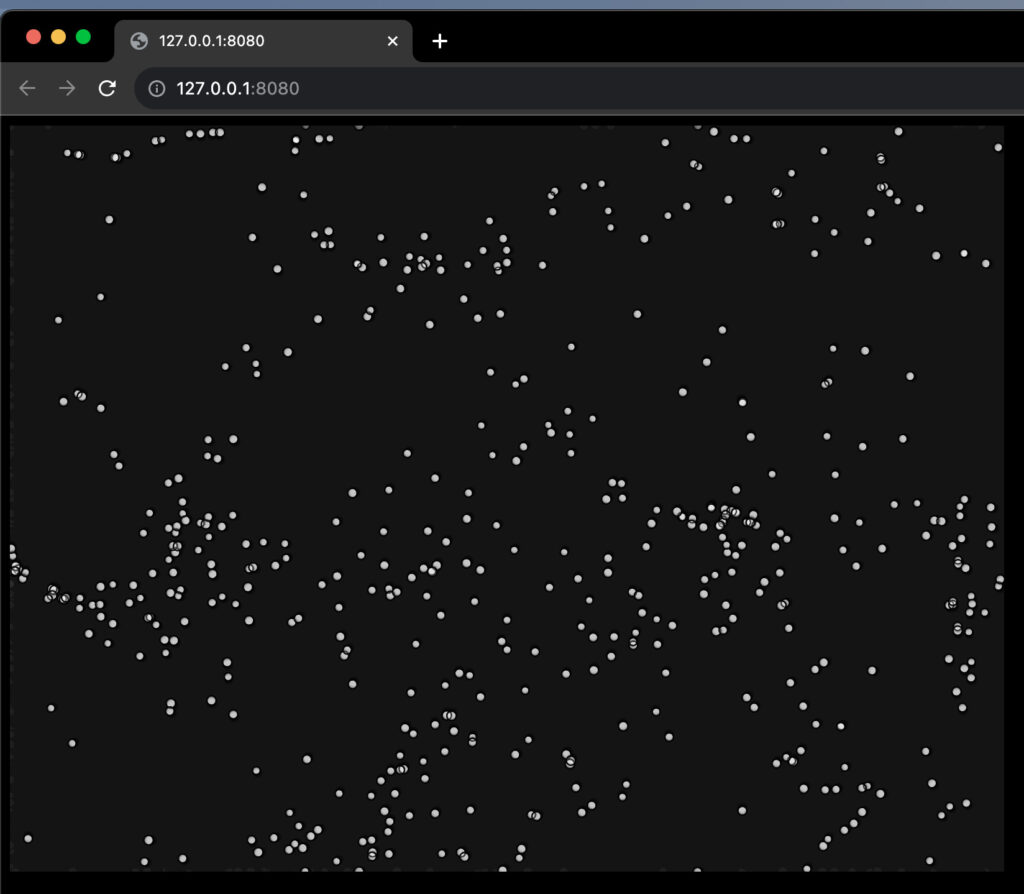
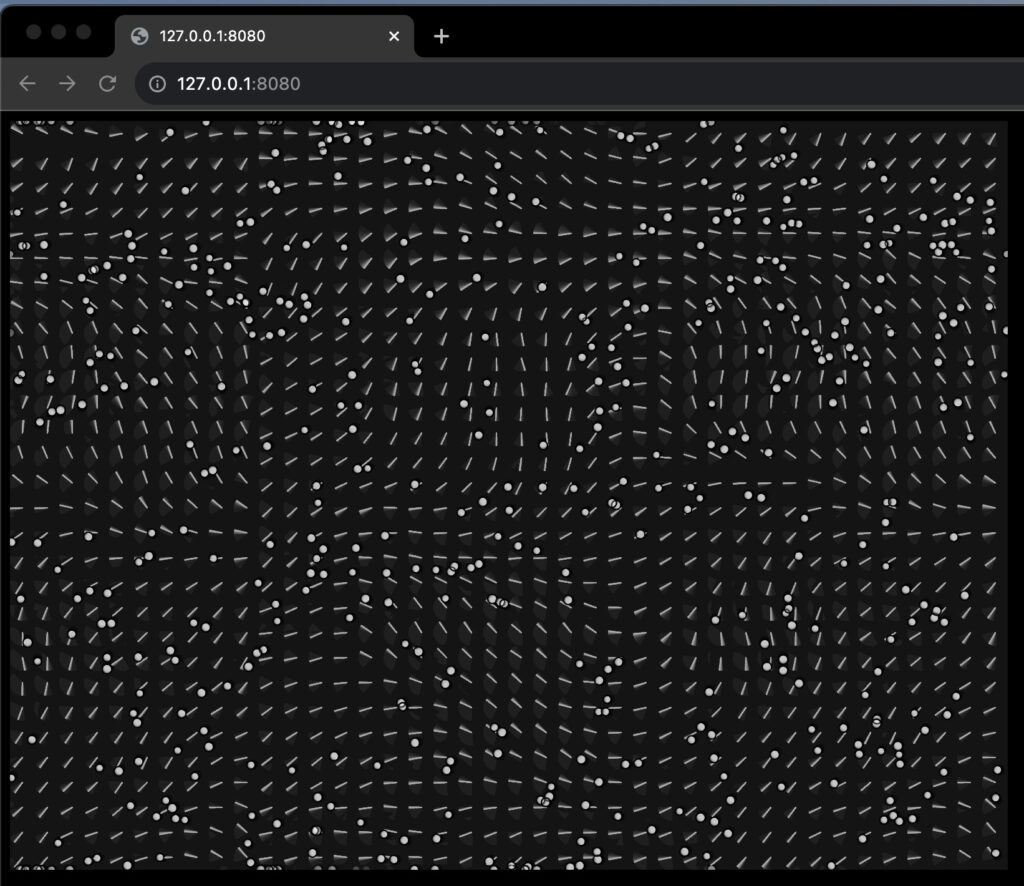
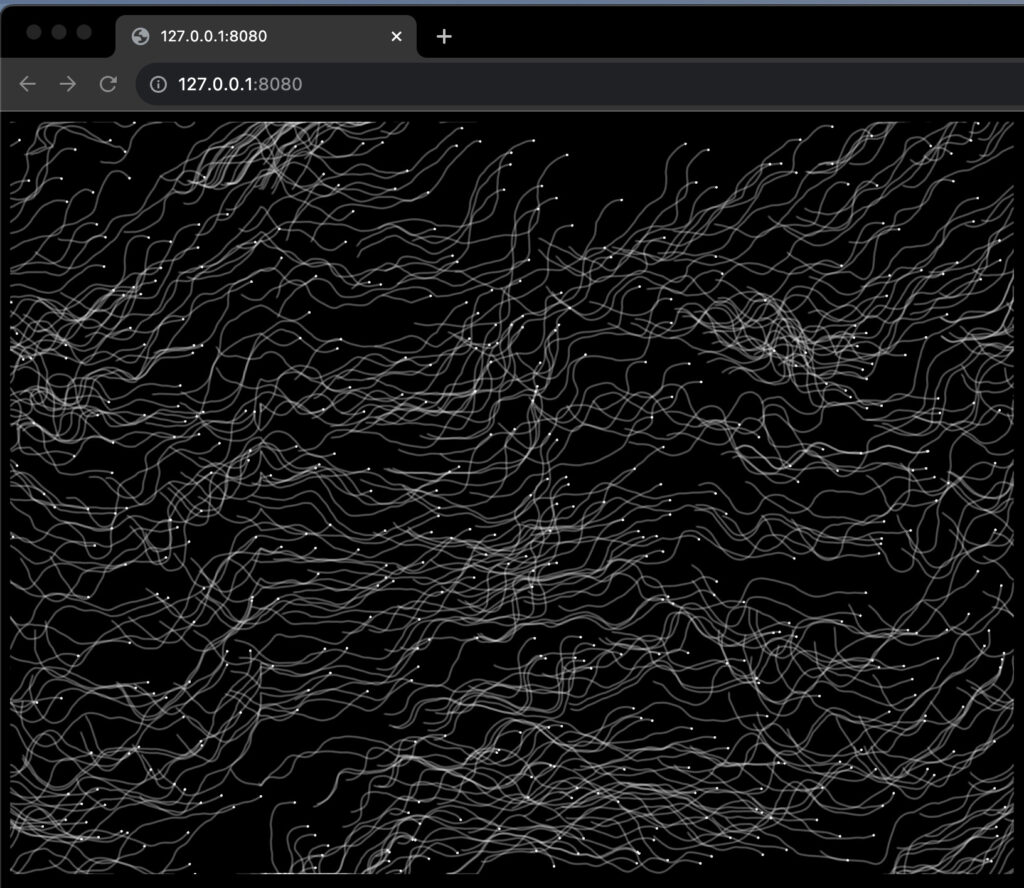
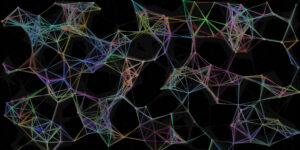
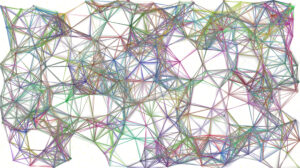
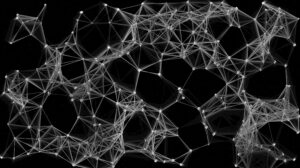
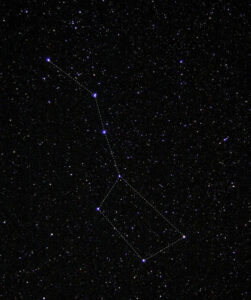
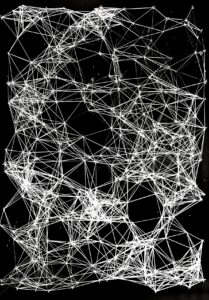
Starry Sketches is a creative generative art project that generates a range of continuously transforming constellation-like patterns. Different iterations of the project accentuate certain elements, like the feel of the sky and its ambiance, the feel of mesmerization, and the feel of amusement.
For my midterm project I began with a route that focused on creating underwater species through creative coding and having each creature evolve into the other in some way or form. This idea was quite interesting and the vision I had in mind was relatively executable. Especially when I came across this project that presented the idea of an evolving circle that led to outcomes similar to what I had envisioned.
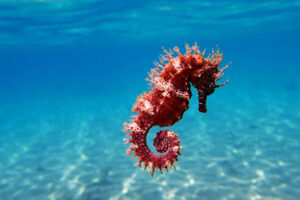
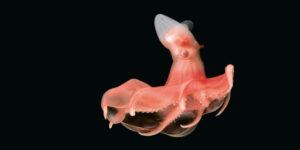
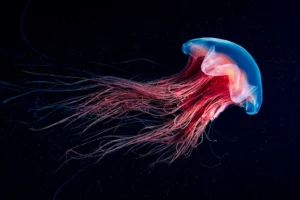
To get the exact feel of an underwater environment, I read about sea creatures, their physical characteristics, and their movement manner. I decided finally to focus on four creatures; sea horses, starfish, jellyfish, and octopuses, which each depict unique movement mechanisms. I found that sea horses only hovered in place to move around, whereas starfish crawled and rowed like crabs did, while jellyfish drifted along the currents of the ocean, and octopuses propelled the current and crawled with their tentacles.
Unfortunately, I was not able to go so far with my idea for it felt static despite my attempts to produce a generative piece. This led me to decide to shift my focus away from underwater environment and onto the skies for some sort of inspiration. Given that I began by working on the starfish for my initial idea, I was very keen on incorporating stars in my project, hence I began looking into that field. When reading about stars and looking through. Images for inspiration, I came across star/ zodiac constellations, which are basically stars in close proximity that create “two-dimensional maps for astronomers to find objects and explain their location and for navigators to use stars to determine their position”. However, nowadays, these constellations are often linked with astrology, and are brought up in the context of zodiac signs. The problem with this based on the article is that it has not scientific foundation, for they are just groups of stars that appear close to each other and are named after objects, animals etc.
When reading that the constellations have no exact shapes that confine them and the zodiac constellations have no scientific basis, I felt a sense a freedom for exploration, unlike with the underwater species where I was unable to come up with an abstract representation of already existing creatures. This enabled me to come up with the idea of creating a sketch that constantly generates new constellations by drawing lines based on the proximity of the stars to one another. That way I was able to incorporate the element of the star that I had already began working on while also ensuring that my project was generative and did not appear static.
Coding Translation, Logic, & Challenges
When I began working on the starfish for my underwater project attempt, I was mostly focused on perfecting the shape of the creature and its movement, failing to consider the bigger picture of how the project will translate to a generative piece.
This led me to creating one long ‘for loop’ which, although eventually unused, was a learning process for me that allowed to explore the function of ‘noise’ in so many different ways, whether that be directly on the coordinates, lines, or even colors,which later came in handy when I worked on the constellations project. Another important take out of this part of my process were ‘nested for loops’ that allowed me to iterate not only through the circumference of a circle but also through its diameter, hence leading to a bunch of nested stars that increase in size with every loop creating one big star.
for(let j=0; j<= 50; j++)
  {
  for (let angle = 0; angle <= TWO_PI; angle += PI/2.5)
{
  let x = centerX + radius * cos(angle);
  let y = centerY + radius * sin(angle) + (3.5 - noise((angle), i / 15) * 7);
  curveVertex(x + noiseX, y + noiseY);
  let x2 = (centerX) + radius2 * cos(angle + HALF_PI / 2.5);
  let y2 = (centerY) + radius2 * sin(angle + HALF_PI / 2.5);
  curveVertex(x2 + noiseX, y2 + noiseY);
}
  //endShape(CLOSE);
  radius-=2;
  radius2-=2;
  }
}
While I was happy with the outcome of the starfish in terms of how it moved and looked, I was not satisfied with the fact that it seemed relatively predictable, and was moving only based on the ‘noise’ that was added to the coordinates, making me feel like I had not incorporated enough from what we have learnt into the project. Hence, moving forward in my process I created a solid plan of what will take place in my sketch.
I started my process simple by creating a class of stars that were of random sizes, positions, velocities, and acceleration, and called a hundred of them to see what the outcome would look like. I immediately realized two main issues with the stars eventually leaving the canvas, and the acceleration increasing nonstop.
class Star
{
  constructor()
  {
    this.position = createVector(random(width), random(height));
    this.size = random(3, 7);
    this.velocity = createVector(random(-0.3, 0.3), random(-0.3, 0.3));
    this.acceleration = createVector(random(-0.01, 0.01), random(-0.01, 0.01));
  }

  update()
  {
    // Update the velocity and position based on acceleration
    this.position.add(this.velocity);
    this.velocity.add(this.acceleration);

   }

  display() {
    let starPoints = random(1, 5);
    let externalRadius = this.size;
    let internalRadius = this.size * 0.4;
    let angle = TWO_PI / starPoints;
    let halfAngle = angle / 2.0;
    fill(255);
    beginShape();
    for (let a = 0; a < TWO_PI; a += angle) {
      let starX = this.position.x + cos(a) * externalRadius;
      let starY = this.position.y + sin(a) * externalRadius;
      vertex(starX, starY);
      starX = this.position.x + cos(a + halfAngle) * internalRadius;
      starY = this.position.y + sin(a + halfAngle) * internalRadius;
      vertex(starX, starY);
    }
    endShape(CLOSE);
  }
}
I added the checkEdges() function like we had previously done with the movers which resolved the issue of the stars flying out of the canvas, however despite adding the ‘limit’ function to the acceleration, the stars continued to accelerate rapidly. I resolved this issue by including an ‘if-statement’ as shown below.
update()
  {
    // Update the velocity and position based on acceleration
    this.position.add(this.velocity);
    // Limit acceleration
    if (this.velocity < 5)
      {
        this.velocity.add(this.acceleration);
      }
   }
Once I had the stars set I began working on the lines which were somewhat a challenge to achieve as envisioned, however I am quite proud of how they came out. I had five different main trials which yielded different results, some of which were actually interesting, but not exactly what I had in mind.
Attempt 1:
In the first trial, my thought process was simple, I need to draw a line between two stars. So, let the first star be ‘i’ and the second one be ‘j’. Through a ‘for loop’ I thought I was incrementing both the i and j values, however, I came to realize that despite thinking I was incrementing the ‘j’ value, the loop constantly equated its value to one position.
let j;
for (let i = 0; i < stars.length; i++)
{
  j = 0;
  stroke (255);
  line(stars[i].position.x, stars[i].position.y,        stars[j].position.x, stars[j].position.y);
  j++;
}
}
Attempt 2:
For my second trial, I tried to have the line drawn between the star ‘i’, and the star that followed it so, star ‘i + 1’. This also yielded an interesting outcome, but again, the issue was that each star was only connectingto two other stars, leading to a static outcome.
for (let i = 0; i < stars.length - 1; i++) {
  stroke(255);
  line(stars[i].position.x, stars[i].position.y, stars[i + 1].position.x, stars[i + 1].position.y);
}
}
Attempt 3:
For my third trial, I knew I was on the right track with the previous two attempts, I had to find a ‘j’ value that was an incrementation of the ‘i’ value but still have that looping and incrementing to avoid static connections between the same stars. Inspired by the nested ‘for loops’ that I had initially created for my starfish, I created a nested loop that produced incrementing values for both ‘i’ and ‘j’. The issue with this attempt however was that there were endless connections between all the stars regardless of their positions.
 for (let i = 0; i < stars.length; i++) {
  for (let j = i + 1; j < stars.length; j++) {
      stroke(255);
      line(stars[i].position.x, stars[i].position.y, stars[j].position.x, stars[j].position.y);
  }
}
}
Attempt 4:
In my fourth trial, I built onto the previous trial. I measured the distance between the stars ‘i’ and ‘j’ using the ‘dist’ function and included an ‘if-statement’ that only allowed for a line to be drawn if the stars were in close proximity.
 for (let i = 0; i < stars.length; i++) {

  for (let j = i + 1; j < stars.length; j++) {
    let d = dist(stars[i].position.x, stars[i].position.y, stars[j].position.x, stars[j].position.y);

    if (d < 100) {
      stroke(255);
      line(stars[i].position.x, stars[i].position.y, stars[j].position.x, stars[j].position.y);
    }
  }
}
}
Attempt 5:
By my fourth attempt I was very happy with the outcome, my only issue was that it seemed like it was not representing constellations accurately because each star was connecting to an endless number of stars. I resolved this issue by a count for the lines to the ‘ if statement’ that measured the distance, that way, a line would only be drawn if the stars are in close proximity and if they are not connected to more than two stars.
 for (let i = 0; i < stars.length; i++) {
  let linesConnected = 0; // Initialize the count of lines connected to the current star

  for (let j = i + 1; j < stars.length; j++) {
    let d = dist(stars[i].position.x, stars[i].position.y, stars[j].position.x, stars[j].position.y);

    // Add a condition to check if the number of lines connected to the star is less than 4
    if (d < 100 && linesConnected < 2) {
      stroke(255);
      line(stars[i].position.x, stars[i].position.y, stars[j].position.x, stars[j].position.y);
      linesConnected++; // Increment the count of lines connected to the star
    }
  }
}
}
Moving on from there, I tried to find ways in which I could improve my code and I looked into any further issues that could be resolved. I realized then that my stars overlapped when moving which did not seem realistic to me. I read into that and found that the likelihood of stars overlapping is very small, if not impossible. So, I created a function within the stars that prevents overlapping.
noOverlap()
  {
    // Loops through every star in the stars array
    for (let singleStar of stars)
    {
      // Checks if the singleStar is the same current star called in the sketch
      if (singleStar !== this)
        {
      // If not then measure the distance between this star and the singleStar
        let distance = dist(this.position.x, this.position.y, singleStar.position.x, singleStar.position.y);
      // Making the minimum possible distance between the stars be equal to their sizes combined
        let minDistance = this.size + singleStar.size;
        if (distance < minDistance)
        {
      // Calculate a vector to move this star away from the singleStar
          let repel = createVector(this.position.x - singleStar.position.x, this.position.y - singleStar.position.y);
          repel.normalize();
          repel.mult(0.5); // Adjust the strength of the repulsion
          this.position.add(repel);
        }
      }
    }
  }
This function was one that I explored in one of my previous assignments, it basically loops for every star in the stars array measuring the distance between it and the current ‘this’ star that is being called. It then creates a repulsion force through a vector that subtracts the position of the stars being compared. This force is then added to the position which leads to the stars repelling or moving away from each other.
To further improve my project I looked into more images of constellations to try and find what is missing in my sketch. I realized that in most images the represent constellations the sky is shown with not only the bright stars that create the constellation but also with all the tiny stars that surround. Hence, I decided to create a class that produces tiny stars of varying sizes for the background. This came out really nice especially since the constructor of the class had 10 stars initialized, hence 10 new stars appeared with every frame creating a sparkling effect in the background.
To accentuate the feeling of stargazing and constellations, I decided to change the background to an image of the sky with stars and I added a music track to further draw in the audience.
I also attempted to create different versions applying the function of ‘noise’ on multiple elements of my project like I did initially when working on the starfish.
Version 1:
update()
  {
    this.position.x += map(noise(this.noiseX), 0, 1, -2, 2);
    this.position.y += map(noise(this.noiseY), 0, 1, -2, 2);
    this.colors = color(noise(this.noiseColor) * 255);
    this.noiseX += 0.01;
    this.noiseY += 0.01;
    this.noiseColor += 0.01;
    // Update the velocity and position based on acceleration
    this.position.add(this.velocity);
    // to limit acceleration
    if (this.velocity < 5)
      {
        this.velocity.add(this.acceleration);
      }
   }
In this version I added noise to the position of the stars and allowed for that noise to constantly update, leading to a trail behind the stars that made them look somewhat like shooting stars. Because of the looping update of the noise and the unlimited change of position the stars move in rapid speeds and seem to be leaving the canvas despite the bounds.
Version 2:
update()
  {
    this.colors = color(noise(this.noiseColor) * 255);
    this.noiseColor += 0.01;
    // Update the velocity and position based on acceleration
    this.position.add(this.velocity);
    // to limit acceleration
    if (this.velocity < 5)
      {
        this.velocity.add(this.acceleration);
      }
   }
In this version I only added noise to the color of the lines and the stars, and changed the alpha/ opacity which was sufficient to create the starry effect I was looking for with having the stars mov out of the frame as in the previous version.
Version 3 & 4:
In these two versions I added an element of color and changed the background to experiment with the effects that I can achieve.
rainbowColors() {
   // Calculate a color based on noise for the star & lines
   let noiseColorR = noise(this.noiseColor);
   let noiseColorG = noise(this.noiseColor + 1000);
   let noiseColorB = noise(this.noiseColor + 2000);
   let noiseColorA = noise(this.noiseColor + 3000);

     starColor = color(
     Math.round(255 * noiseColorR),
     Math.round(255 * noiseColorG),
     Math.round(255 * noiseColorB),
     Math.round(255 * noiseColorA)
   );
 }
Pen Plotting Process
My process with the pen plotting was luckily simple, although I did struggle initially with exporting the SVG files, however, once I had that figured out the process was relatively smooth.
The issue that arose with the SVG file was from the beginning of my project process when I was working on the starfish. I realized after multiple trials that the problem was not with my method of exporting but rather with the size and elements of the sketch itself. Given that my sketch of the starfish had a great deal of ‘noise’ embedded in its design it made exporting the file into an SVG impossible.
I took that into account when working on my new project with the constellations, and made sure that I worked based on that leaving any ‘noise’ or extensively large elements out of my design for plotting purposes.
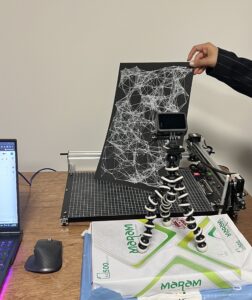
In doing so I was able to get an SVG file ready for plotting. The only editing I had to do on Inkscape was remove the background. From there we imported the sketch to the plotter and it began the process which was quite lengthy since I decided to give the star the flexibility to connect to an endless number of nearby stars and I also called 300 stars on the canvas.
Areas of Improvement & Future Work
In terms of improvement and future work, I came across an article that details collisions of stars when reading about whether or not stars overlap. This article mentioned an interesting detail about stars’ collisions explaining that in the rare cases that they collide, if moving at a slow pace they merge to create brighter stars, and if traveling at a fast pace during the collision then they disappear leaving behind only hydrogen gas. I attempted to add this to my sketch however,I was unsure of how to go about it and since I was somewhat tight on time I decided to leave this as a future addition to the project.
One thing that I realized later could be improved is the way in which the lines appear. Right now the lines immediately connect the stars once the sketch is played. What I think would look nice if the lines connected slowly and gradually to one another. I attempted to work on this issue by adding by only allowing the lines to appear after a certain frame count, however, that only postponed the time of which all the lines appeared simultaneously. I am hoping to edit this soon to create a more smooth-looking environment.
Link to fullscreen: https://editor.p5js.org/llluka/full/NvFLbfOZK
Images of different compositions:
Concept
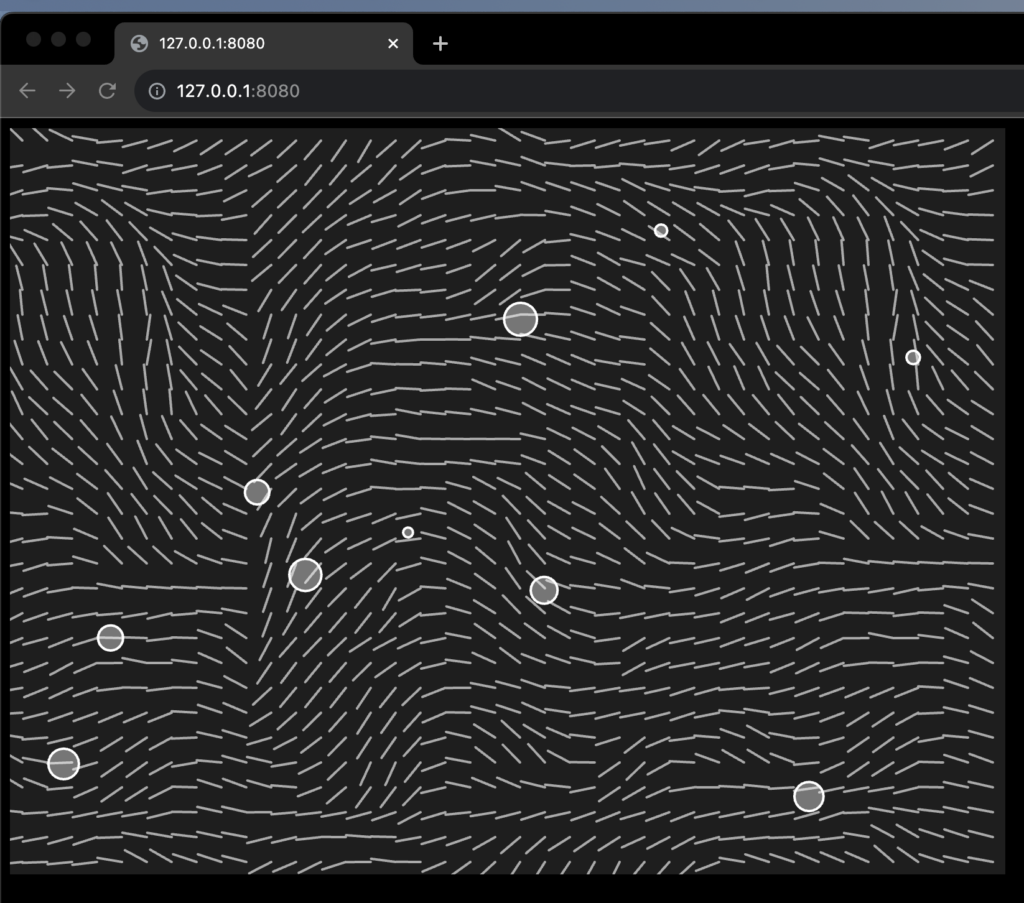
This project aims to build a dynamic and visually appealing simulation of magnetic particle and magnet interactions. It allows users to examine the behavior of these magnetic forces in a virtual environment by utilizing the p5.js framework. It’s intended to be both an interactive and instructional tool, with users able to change the amount of magnets, the number of particles generated, and even the particle colors. The simulation’s basic goal is to demonstrate how particles behave to magnetic fields, exhibiting the attraction or repulsive forces they encounter based on their individual charges. By incorporating the concept of powered distance, where forces weaken rapidly with increasing distance, the project effectively captures the essence of magnetic interactions in a visually intuitive manner. Overall, this project provides an engaging approach to visualize magnetic principles while also giving users the ability to influence particle behavior in response to changing magnetic conditions.
Coding Logic
This project’s technical execution is driven by two central classes, “Magnet” and “Particle,” which serve as the building blocks for the magnetic simulation. Magnets are initialized with randomized positions across the canvas in the simulation, providing an element of unpredictability to their arrangement and the produced pattern. The ability of these magnets to switch between attraction and repulsion, which is controlled by user input (‘t’ on the keyboard), gives the simulation further variety. Particles, on the other hand, are also given random starting points, contributing to the generative aspect of this sketch. The movement of the particles is controlled by the magnetic forces exerted by the magnets.
Another key component of the simulation is the “powered distance” factor. The choice of a power exponent (in this case, set to 4 for visual and aesthetic reasons) greatly influences how the magnetic forces weaken with distance. By amplifying the distance factor to the fourth power, the simulation is an illustration on how magnetic principles work, with stronger forces close to the magnets and rapid reduction in forces as particles move away.
Regarding the content learned in class, I relied heavily on vectors and forces. The idea was in a way similar to movers and attractors, and combining it with particles is what produced the final result.
Challenging Parts
The main and most difficult part was simulating the magnetic force between the particle and the magnet. I had to apply the Inverse Square Law for Forces, since many physical forces, including gravity and electromagnetic forces (which magnetic forces are a part of), follow this law. This law states that the strength of a force is inversely proportional to the square of the distance between the objects involved. Mathematically, it’s represented as:F ∝ 1 / r^2 -> the force (F) is directly proportional to the inverse square of the distance (1 / r^2). Here is my update() function inside the particles class that deals with the magnetic force:
update(magnets) {
    // Update the position of the particle based on magnetic interactions
    let sum = createVector(); // vector that accumulates the magnetic forces

    // iterating through the magnets and calculating the forces they exert on the particle
    for (let magnet of magnets) {
      let diff = p5.Vector.sub(this.pos, magnet.pos); // calculating the vector between particle and magnet
      let poweredDst = pow(diff.x, dstPow) + pow(diff.y, dstPow); // calculating the powered distance, which is used to determine the strength of the force between the particle and the magnet. The higher the poweredDst, the weaker the force.
      let force_mag = (this.power * magnet.power) / poweredDst; // (this.power * magnet.power) determines whether the particle and the magnet attract or repel each other based on their powers. If they have opposite powers, they will attract , and if they have the same powers, they will repel. (this.power * magnet.power) / poweredDst calculates the force magnitude by considering the power and distance. A larger poweredDst results in a weaker force.
      diff.mult(force_mag);
      sum.add(diff); // accumulating the forces.Adds the current force to the cumulative force. Since multiple magnets can affect the particle, and this line accumulates their combined effects.
    }

    this.pos.add(sum.setMag(1).rotate(HALF_PI)); // Update the position based on accumulated forces
  }
Pen Plotting translation/ process
Pen Plotting was the most exciting part of the project, as it was highly
satisfactory to observe a digital sketch come alive in a physical form. The
challenging part was dealing with the SVG files, as for some reason particles would extend outside the canvas in the exported SVG file, which did not show up in the P5.js sketch. This became complicated as there were no borders and the Pen Plotter would catch the edge of the paper and thus it took a couple of tries to plot the sketch right. I used the version of my sketch that only had the white lines to export the SVG files. That version of code also had an altered Particle class that saved the previous position and would draw a line between previous and current positions rather than an ellipse at a current position. (I removed the SVG code from the sketch so that the code runs faster, but apart from that and the canvas size, nothing else was altered).
Areas for improvement / future work
A feature that I would implement next would be giving the magnets some movement. I believe it would make the sketch more dynamic, and it would be interesting to observe how the particle movement would change when the magnets would move versus what it is now when they are static. From aesthetic perspective, it would have been interesting to experiment with light, perhaps adding some glow to the magnets or the particles when they collide with magnets. Combining that with a bit of shading or fading perhaps would give the sketch some depth and make it appear more 3D.
“Generative Artistry” is a project that seamlessly transitions from an interactive Pac-Man-inspired game to a mesmerizing display of generative art. This transition serves as a metaphor for the creative process itself, highlighting the unpredictable and varied approaches artists take to contribute to a shared vision. The project simulates the collaborative work of artists, with each “artist” independently contributing to the creation of a shared artwork.
Artistic Vision 🎨
Inspiration 💡
The inspiration for this project was to explore the idea of how multiple artists, each with their own unique style and perspective, can collaborate to create a shared artwork. The project draws inspiration from the chaos and unpredictability of artistic creativity and how individual contributions can come together to form a cohesive whole. The use of randomness, metaphor, and progressive revelation in the project aims to engage users and make them part of this creative journey.
Research 🔍
Initially I had an issue where every artist was working independently and the final outcome was quite messy and random, so I had to tweak the randomness part and researched how to make the each individual part to be relatively close. This led me to the topic of image convolution (8 neighbouring artists influence the 9th artist so that eventually the art doesn’t loose the original silhouette).
Coding Translation and Logic 🔄
The project was meticulously planned to create a seamless transition from the Pac-Man game to generative art. The main challenge was coordinating the actions of individual “artists” (represented by circle balls) to ensure that their movements and colors contribute to the overall artwork.
Coding Logic 💻:
The Pac-Man game is created with user control of a red ball using arrow keys.
Once all yellow balls are consumed, the game transitions to generative art.
The generative art canvas is populated with circle balls that move unpredictably.
Each walker looks looks for 8 neighbouring colors to have the same scale of color for current pixel in the canvas.
Each circle ball represents an “artist” and leaves a trail of colors behind.
The collective movement and colors gradually form a shared artwork.
Coding Snippet 📝:
// Code snippet for handling the transition from game to generative art
if (pacManEaten) {
  // Transition to generative art
  gameState = "art";
  initializeArtists();
}
// propogated rgba color value for given pixel that depends on color of neighbouring pixels
let color = [0, 0, 0, 0];
neighbors.forEach((neighbor) => {
  // pixel values of neighbour pixel
  let pixelColor = img.get(neighbor[0], neighbor[1]);
  // randomizing and color transformation
  if (!this.targetKnown) {
    // in case there is no given target image, then abstract colors
    color[0] += pixelColor[0] + random(-20, 50);
    color[1] += pixelColor[1] + random(-20, 50);
    color[2] += pixelColor[2] + random(-20, 50);
    color[3] += pixelColor[3] + random(-20, 50);
  } else {
    // in case there is a given target image
    color[0] += 255 - pixelColor[0] + random(-20, 50);
    color[1] += 110 - pixelColor[1] + random(-20, 50);
    color[2] += 200 - pixelColor[2] + random(-20, 50);
    color[3] += pixelColor[3] + random(-20, 50);
  }
});
// max rgba color values among neighbouring pixels; it is needed to map the pixel color to 255 range because each rgba value is a sum of neighbours
let maxColor = [0, 0, 0, 0];
neighbors.forEach((neighbor) => {
  let pixelColor = img.get(neighbor[0], neighbor[1]);
  let overall = pixelColor[0] + pixelColor[1] + pixelColor[2];
  let maxOverall = maxColor[0] + maxColor[1] + maxColor[2];
  // tracking the max pixel color
  if (overall > maxOverall) {
    maxColor = [pixelColor[0], pixelColor[1], pixelColor[2], pixelColor[3]];
  }
});
color = color.map((c, index) => {
  // mapping the rgb color to 255 range and mapping alpha to 0-1 range
  if (index === 3) return constrain(c / neighbors.length, 0, 1);
  return Math.floor(constrain(c / neighbors.length, 0, 255));
});
Coordinating independent movements of the “artists” to create a cohesive artwork.
Implementing a system where each artist’s color and movement are influenced by its neighboring artists.
Creating a smooth transition between the game and generative art phases.
Proud Moments 😊🏆:
Successfully achieving coordination among individual artists, creating a shared vision.
Utilizing kernel operations on image matrices to ensure that artists’ colors are influenced by their surroundings.
Tweaking different colors.
Pen Plotting Translation 🔄
Pen plotting was utilized to create a physical representation of the generative artwork. The code had to be adapted to accommodate for plotting, taking into consideration factors such as pen movement, paper size, and ink color.
Pen Plotting Process 🏭:
The generative art canvas was scaled to fit the plotting paper size.
Pen movements were synchronized with the movements of the “artists” on the canvas.
Special attention was given to adjusting the line weight and color to achieve the desired physical output.
In order to generate more aligning SVG files, I reduced the number of walkers so that less noise and less trace is left on the canvas.
To make the plotting more visually appealing, I layered the same SVG on top of itself and moved a bit to sides to create a glitch effect, drawing each layer with different colors.
Areas for Improvement and Future Work 🔍📈🔮
While the project successfully demonstrates the collaborative aspect of generative artistry, there is always room for improvement and expansion:
Collaborative Interaction: Enhance the collaborative interaction among “artists,” allowing them to influence each other’s movements and colors more dynamically.
User Engagement: Implement additional interactive elements to engage users during both the game and generative art phases.
Visual Enhancements: Experiment with different visual effects and techniques to create even more stunning generative artwork.
Extended Metaphor: Develop the metaphor of the creative process further to provide users with a deeper understanding of the art-making journey.
Expand Plotting: Explore the possibility of creating physical artworks with more complex pen plotting techniques, potentially incorporating new media or materials.
Overall, “Generative Artistry” provides a captivating experience that can be further developed and expanded to explore the depths of collaborative art creation and user engagement.
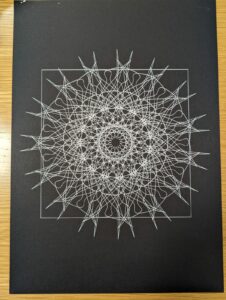
My original inspiration for this project was Mandalas, they are intricate geometric designs that radiate out from a central point. In many cultures, they’re used for spiritual symbols, meditation aids, or just as beautiful artworks. Mandalas fascinate me with their mix of complexity and simplicity, order and chaos. Through this project, my goal was to merge generative art with Mandalas. I aimed to create an entrancing and visually aesthetic piece of generative art.
First Iteration:
I had really wanted to use the WEBGL library to create 3D sketches. My first attempt at this idea was to overlay many geometric shapes on top of each other in a 3D environment, while zooming in and out of the center, and manipulating the depth between the layers to create an infinite tunnel effect simulating a mandala.
Challenges in SVG Adaptation:
Adapting the original WEBGL 3D sketch to SVG for printing presented some difficult challenges. There’s an incompatibility between the WEBGL and SVG libraries as the field used for SVG in Createcanvas() was also occupied by WEBGL so it was impossible to capture SVG through p5. Even attempting a workaround, such as converting a screenshot of the sketch from PNG to SVG, proved unsuccessful. The intricate details, especially in the inner sections of the design, were lost and impossible to capture using this method. So I decided to create a 2D variation that incorporated similar concepts to the original which was the creation of mandalas using predefined shapes which were randomly picked and overlaid on top of each other.
While this method did yield usable SVG files, they were not satisfying creatively. I felt that I did not utilize any generative concepts in my project. So I decided to start over again and make a new sketch.
Pivoting from the Original Sketches:
My initial design was based on predefined shapes, which limited the generative potential. I did some more research into how to recreate mandalas in p5js and discovered the concept of axes of symmetry in combination with Perlin noise and Vectors which we took in class, both of which opened up a lot more possibilities for the project.
The X and Y axis movement is gotten from Perlin noise. An offset value is required to be added to x or y offset so that the output is a straight line. The timer variable is used in the SVG sketch to stop the drawing so that it can be saved as an SVG. In update() it saves the previous x and y positions so that a line can be drawn between the current and previous points. x and y offset is then incremented to continue moving the line.
let sw = 2;
strokeWeight(sw);
for (let i = 0; i < this.symmetry; i++) {
  rotate(this.angle);
  line(this.mx, this.my, this.px, this.py);
  push();
  scale(1, -1);
  line(this.mx, this.my, this.px, this.py);
  pop();
}
pop();
This loop runs for each axis of symmetry. With each iteration of the loop, it rotates the canvas by this angle, ensuring that the lines are drawn evenly spaced around the central point. scale() then flips the y-coordinate for mirroring.
Incorporating all of these elements allowed for more dynamic and unpredictable patterns, while still maintaining the structured, symmetric essence of Mandalas.
The following is the SVG version of the Sketch:
This worked well for the pen plotter and yielded a very cool and intricate-looking pen plot:
Final Steps:
While the initial SVG version yielded very cool results for the pen plotter, it still lacked that entrancing effect that I was seeking to create in the original sketch. So I decided to experiment with the parameters of the sketch. Instead of the timer being used to stop the drawing, I repurposed it to change the axes of symmetry and other variables such as the offset and color.
From my experimentation, the offset dictates how flowy and smooth the lines are. If the offset is high then the lines become more rigid and geometric. By playing around with the ranges of these values, I managed to create a very immersive experience:
To add a final twist to the sketch I decided to add audio into the sketch. My pick was the track named “Can you hear the music” from the movie “Oppenheimer”. The reason I picked this track was because of its gradually increasing tempo and volume which I felt would be ideal to complement the entrancing effect of the sketch. In addition to this track, I again, modified the values and ranges to be based on the volume of the track being played.
let level = amplitude.getLevel();
minaxis = round(map(level, 0, 1, 4, 30))
maxaxis = max(minaxis,maxaxis);
increment = map(level*0.8, 0, 1, 0.0008, 0.3);  // Adjust the range as necessary
offset = map(level, 0, 1, 0, 1000);
By getting the level of amplitude, I can use it to adjust all the values such as the number of axes of symmetry, increment (speed of the lines), and offset (smoothness).
VR: Due to the nature of this sketch I think that it would be very interesting to port it to VR. I think that It would really enhance the experience and take it to the next level.
User Interactivity: To make the experience more engaging, we could introduce interactive elements where users can adjust parameters in real time. For example, allowing them to modify the axes of symmetry and color gradients.
Final Thoughts:
The journey of this project, from its initial conception to its final iteration, has been a testament to the iterative nature of design. With each hurdle, I adapted and refined my design, merging traditional Mandalas with modern generative techniques. Each challenge and pivot brought about new insights and perspectives, ultimately leading to a richer, more dynamic end product and I am very happy with how it ended up looking.
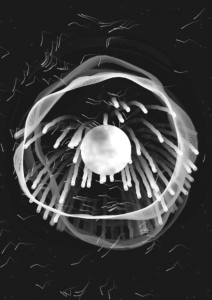
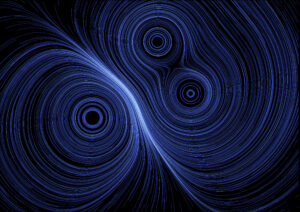
My inspiration for this project arises from both my profound fascination with astronomy and another course I am enrolled in this semester, titled “Astronomy and Cosmology: From Big Bang to the Multiverse.” While studying the Sun in this class, including its composition, origin, magnetic fields, and the nuclear reactions that fuel its ability to emit enough energy essential for life on Earth, I decided to base my midterm project on the most important source of energy for humanity, the Sun.
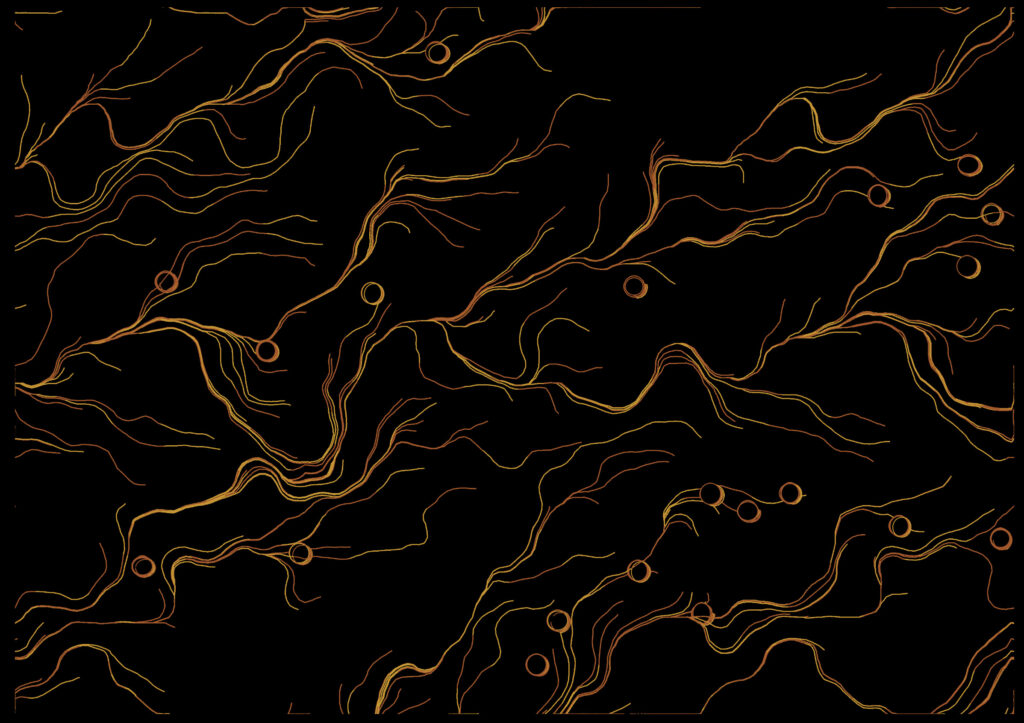
During my research, I found a captivating visualization video from NASA’s Goddard Space Flight Center.
This video provides various visualizations of the Sun from different angles, as observed from the Earth. While the visuals are striking, there are several intriguing phenomena at play. What we witness in the video is the Sun’s Photosphere, often referred to as its surface. Here, something remarkable happens. The Sun, primarily composed of Hydrogen (H) and Helium (He), has a complex and large magnetic field. Sometimes, these magnetic fields breach the surface, giving rise to what we know as sunspots. These sunspots are regions on the Sun’s surface, usually dark spots, caused by exceptionally strong magnetic fields. They appear darker than their surroundings due to their lower temperature, a result of the magnetic field hindering the flow of heat.
Furthermore, due to the Sun’s absence of a solid structure and its composition of gaseous matter, different regions of the Sun rotate at varying speeds. For instance, the equatorial areas of the Sun complete a full rotation in approximately 24 days, whereas the polar regions take more than 30 days to complete a full rotation. Consequently, these variations in rotation make it appear like clouds composed of various gases are moving at different speeds. Also, the presence of solar flares and solar prominences adds to the spectacle. They create ring-like structures on the Sun’s surface, further enhancing its mesmerizing beauty and complexity.
There are many things to consider, but I decided on taking a few important things for my version of the visualization for a generative art project.
The illusion of the movement of gases on the Surface
Energy flowing along the magnetic fields of the Sun
The ring-shaped Solar Prominence
Note: Although it is an injustice to the Sun to visualize it in 2D, I would like to point out the complexities of being able to encompass everything about the Sun in a relatively shorter time frame compared to hundreds of years of Astronomic research.
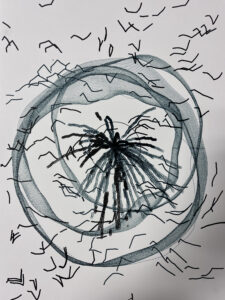
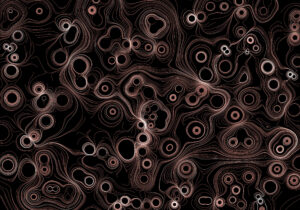
Results
Here’s a plotter version of the Sketch. I like this one better, although more work went into building the version above.
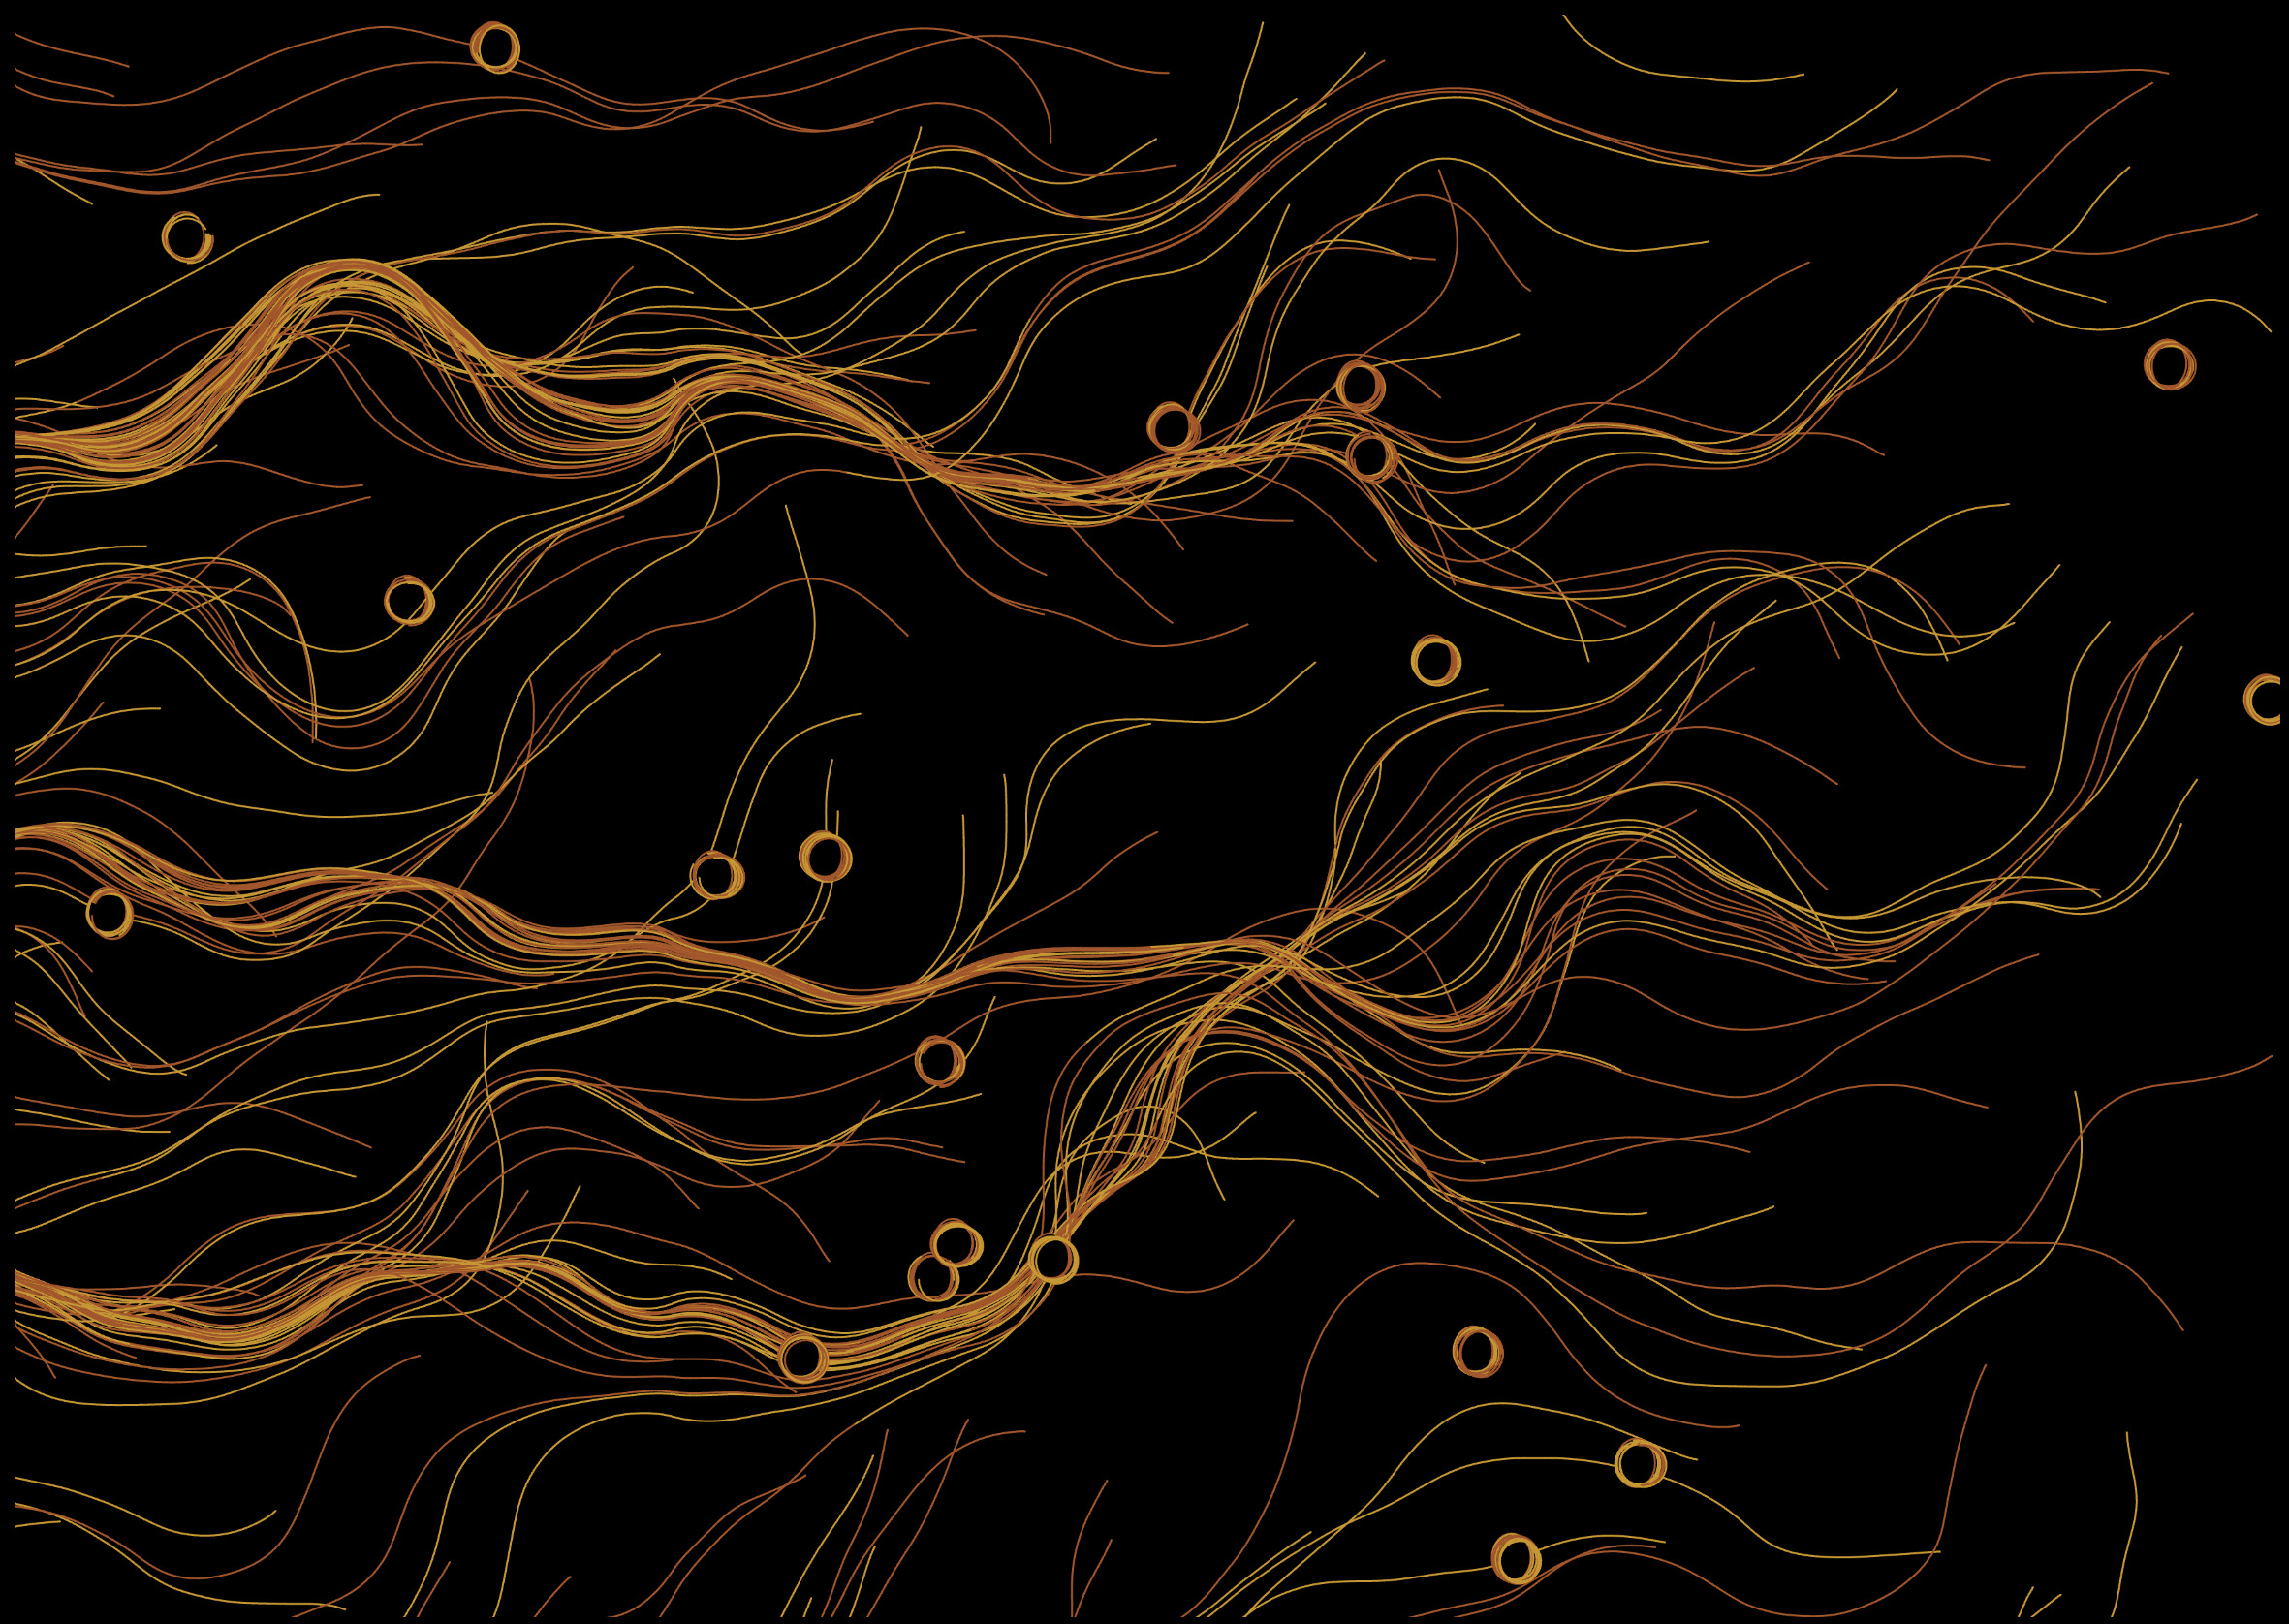
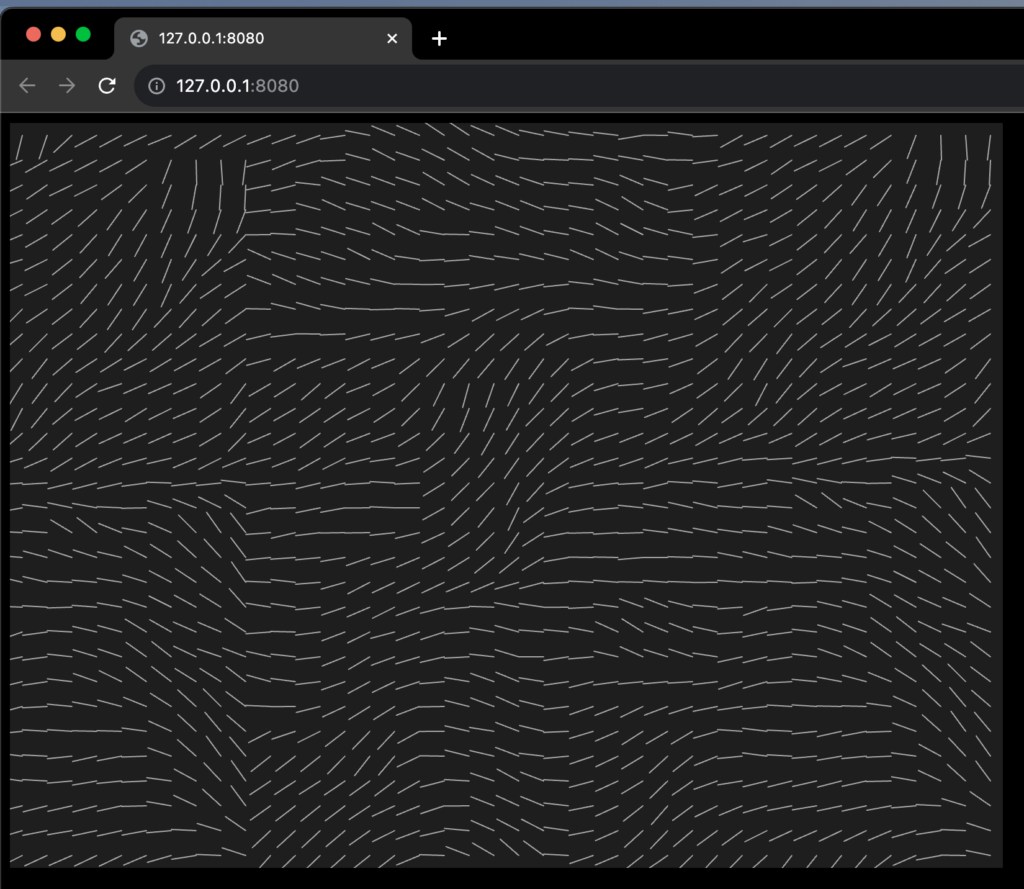
At first I did some research on how I could visualize the phenomenas described above. I found a helpful video by Daniel Shiffman from The Coding Train. This video describes Perlin Noise and Flow Fields, which is quite useful in creating the movements of the particles along the Sun’s complex magnetic fields.
Here are a few screenshots of the development process:
Coding
The most important part for me in the beginning was to be able to create the 3 phenomenas mentioned above: the surface, flowing particles, and the rings.
I have created two classes: Mover and Rings, and rest of the logic remains on the sketch file. Each item that creates a trailing line is a Mover. 6000 movers are put into the sketch first then a vector field is created. These movers move on the vector field (also called flow field). Whenever a mover is near to a vector in the vector field, which, by the way, are rotating continuously using Perlin Noise to change directions, it gets ejected using the direction and magnitude of the vector it comes across. And adding an illusion of trailing using alpha values in the colors, as well as adding blur and shadows, make it feel like hot gases are flowing in the vector field.
For the surface, I am getting pixel values of the whole sketch using loadPixels() and for each pixel, I am setting an alternating yellow and orange colors along with randomized alpha values. This makes it appear like hot gas clouds are moving on the surface.
What was challenging?
The rings. I tried and scraped so many ideas on creating the rings, but eventually agreed on doing what’s seen on the sketch. The rings are arcs, placed elegantly using ellipse properties, but also containing blur, shadows, and alpha values.
Here’s what I wrote after quite a lot of experimentation:
display() {
    // draw the ring if frameCount is greater than 240
    if (frameCount > 240) {
      // set ring properties: no fill, shadow color, and shadow blur
      noFill();
      drawingContext.shadowColor = color(254, 231, 4, 2);
      drawingContext.shadowBlur = 20;

      // choose a random stroke color from the colors array
      stroke(random(10) > 5 ? this.colors[0] : this.colors[1]);

      // draw an arc with varying parameters
      arc(
        this.pos.x + this.offsetX,
        this.pos.y + this.offsetY,
        -this.a * 1.5,
        -this.b * 1.5,
        (PI / noise(this.pos.x)) * 10,
        PI - 10 * (frameCount % 100)
      );
    }
 }
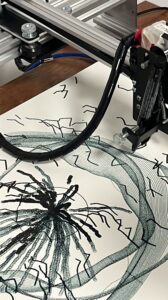
Pen Plotting
To be able to plot using the Plotter, I had to remove all opacity related variations from the code. As the plotter would plot everything in full opacity, there was no point of adding them on the sketch. Therefore, I made many changes.
Removed opacity-related code.
Removed the background (the Surface of the Sun as it was mainly playing with alpha values for the cloud-like behavior)
To create an optimized SVG file, I updated the code so that the trails are created using lines, not vertices. This is because the plotter would only draw lines from one point to the other.
Made it such that the color for each trail changes in between. Each trail would be composed of two colors based on random decisions in between the trail.
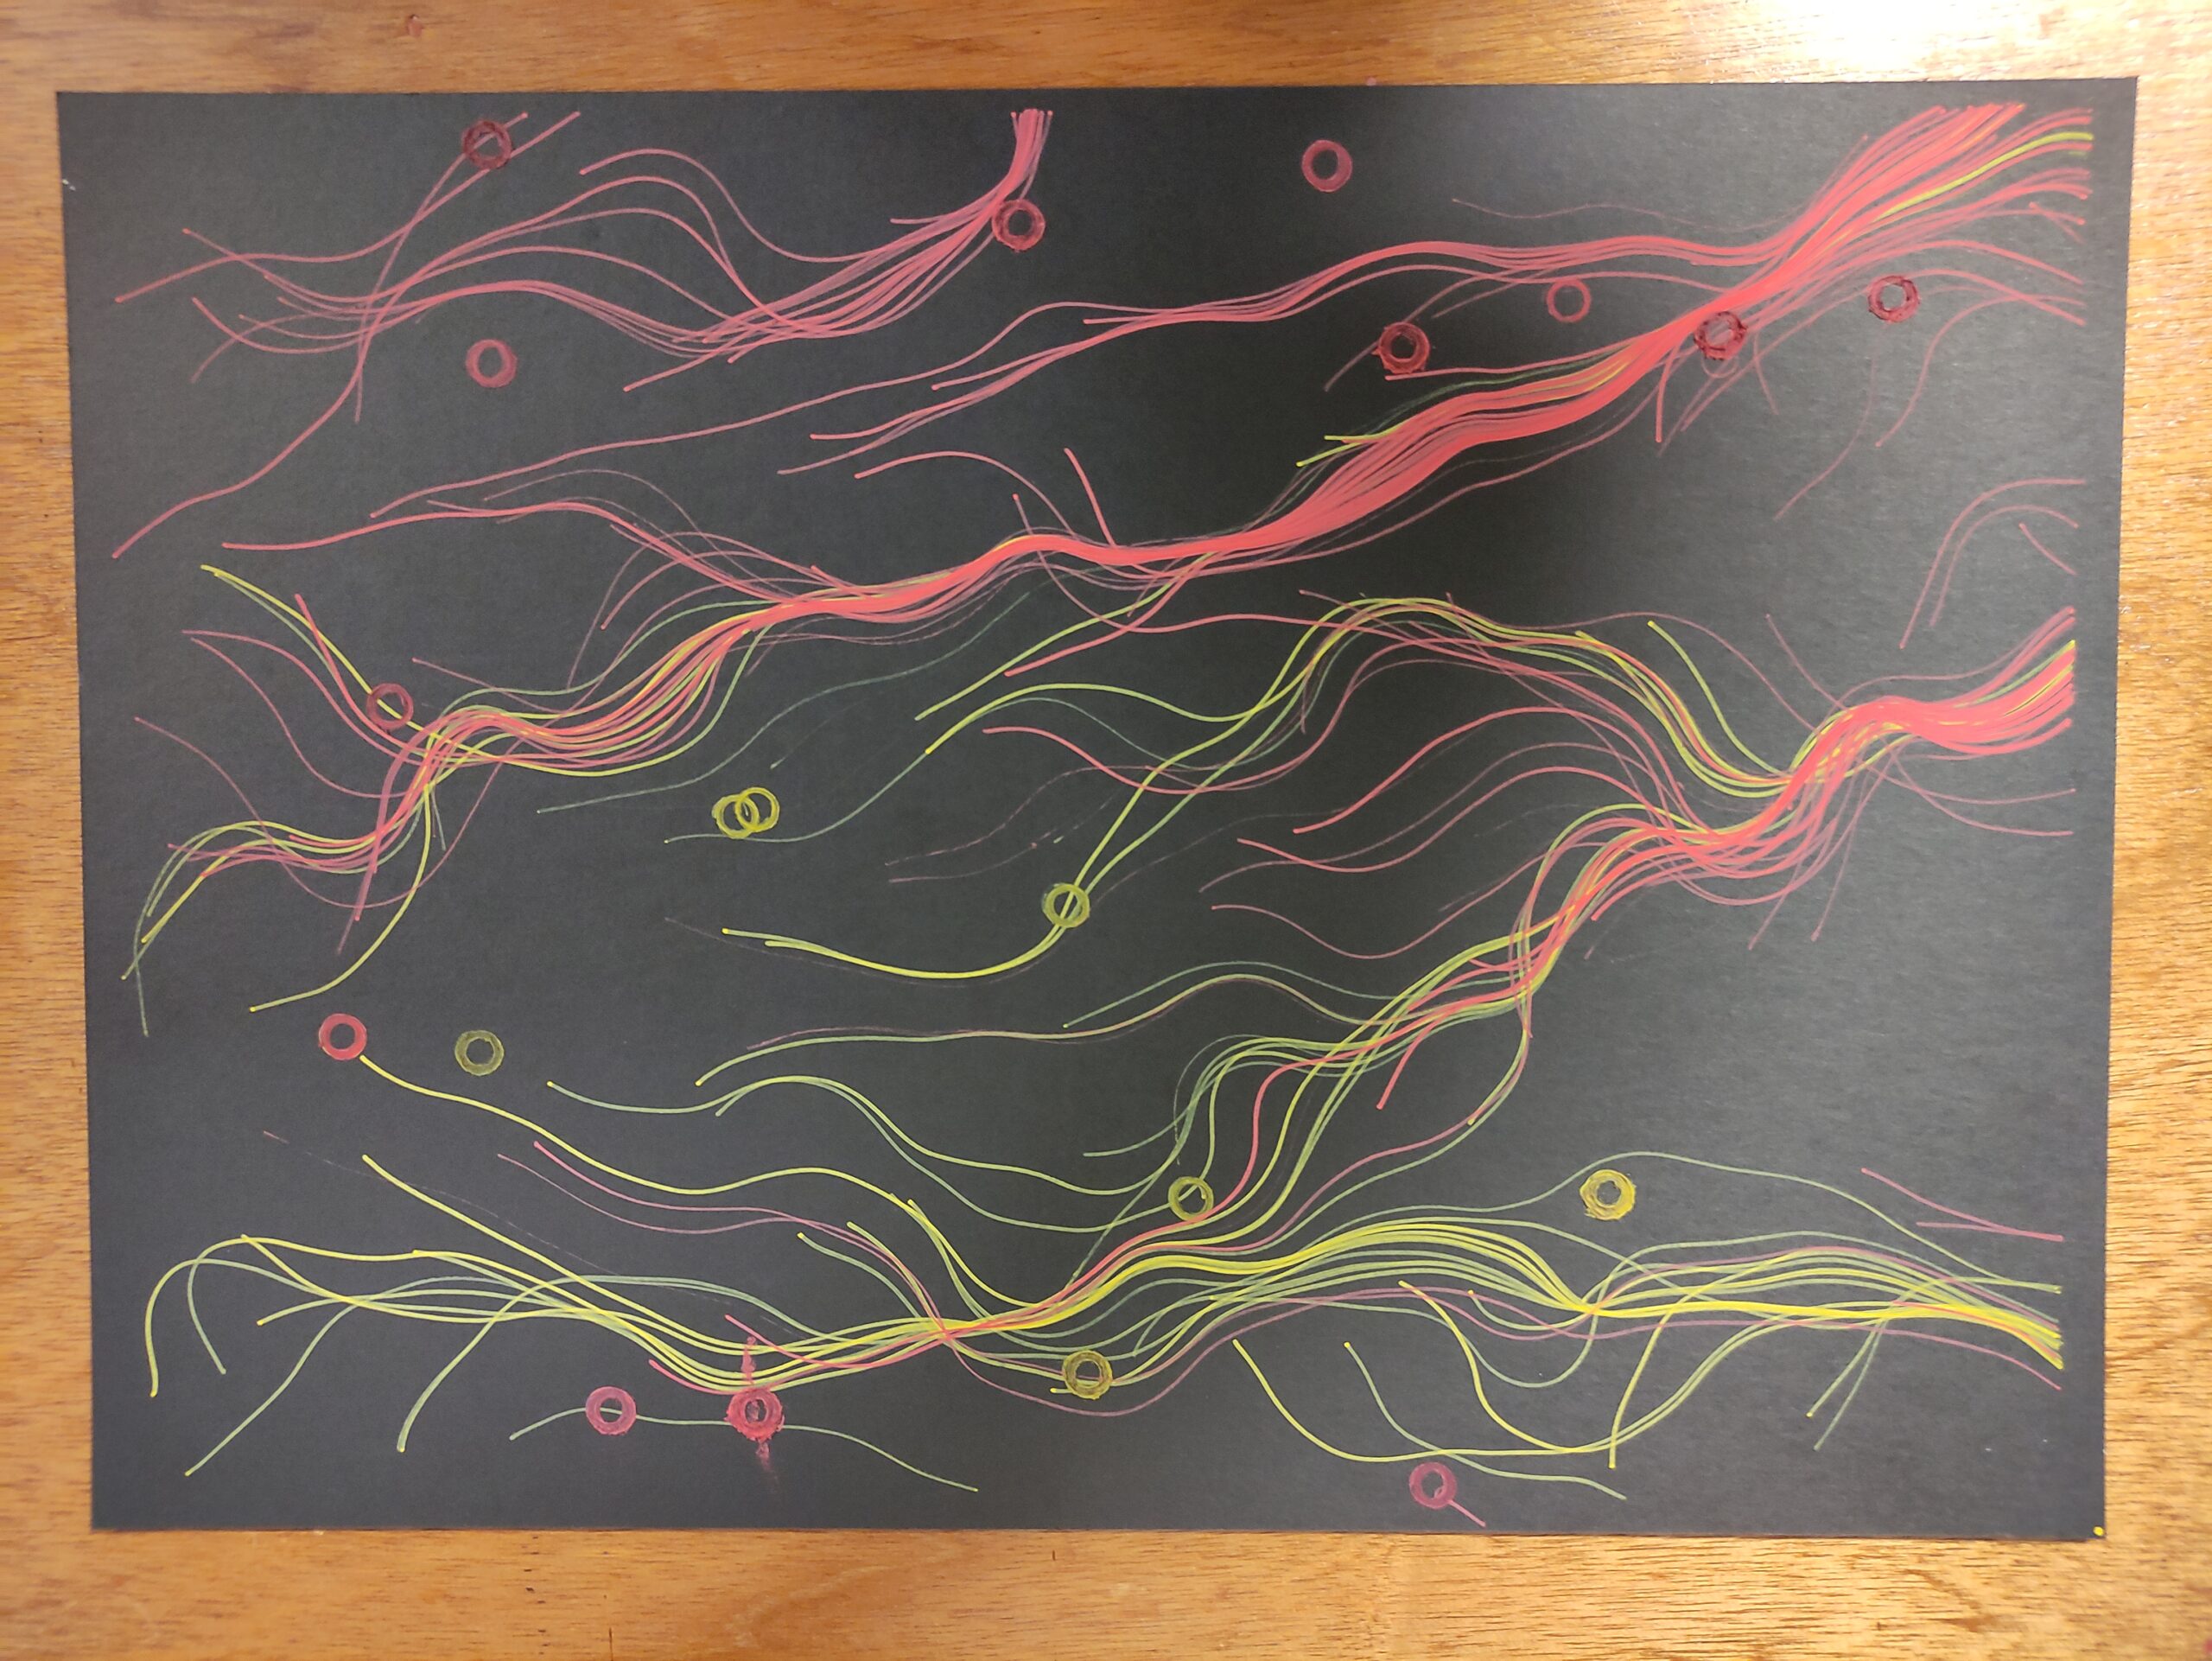
Pen Plotted Photo
Timelapse Video of Pen Plotting
Concepts taken from the Course
Randomness
Noise
Vectors
Velocity
Acceleration
Force
Future Work
I would love to work more on the rings. I think it has a lot of potential if executed correctly.
I would also like to use this sketch as a texture for a sphere drawn in 3D space. This would make it look actually like the Sun.
Luminosity is also something that can look really good if done correctly.
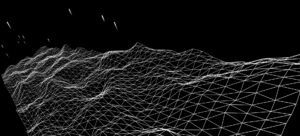
The sketch appears to draw inspiration from the iconic sci-fi movie, Tron. Tron, released in 1982, is known for its distinctive visual style characterized by neon-colored, grid-like landscapes and futuristic aesthetics. The sketch’s terrain generation with lines and triangles resembling a digital grid resonates with the world inside Tron’s computer system. The use of a dark, black background, along with the bright, neon-like stars and the red attractors, strongly evokes the movie’s signature color scheme. This is meant to instill nostalgia in the movie’s viewers.
Tron aesthetic:
The code is organized to create a visually appealing 3D scene with a grid-like terrain, moving stars, and potentially moving attractors. The use of Perlin noise for terrain generation adds a dynamic and abstract element to the sketch. Object-oriented programming is employed to encapsulate and manage different elements, making the code more structured and readable.
Screengrab:
Hand Sketch
Pen Plotter sketch
Since this sketch uses webGL I could not use the SVG export code. Hence I resorted to a screenshot which i converted to SVG in inskscape. I made two changes in order to accommodate for the plotter format. First I reduced the number of rows and columns which effectively reduced the vertices of the sketch and in turn lowered the complexity. I also increased the x.off and y.off values which made the terrain more turbulent. This was to compensate aesthetically for the lower vertex count.
Pen Plotter timelapse:
Future improvements:
I want to make the experience more immersive by allowing the sure to control the camera angles, thereby letting them traverse the terrain on their own at any POV.
I also want to apply textures to the terrain. Instead of a plain grid, I can use textures to make it look like an alien landscape, a digital city, or any other thematic environment.
I have finally finished my midterm project, plotting and printing and all!
In this post I will mostly talk about the pen plotting experience and the necessary adjustments I’ve made to my original code in order to help the machine understand and read the code.
Process of SVG:
I have tried two methods in trying to save my code as an SVG file during this midterm, which are the following:
Implementing the SVG system into my p5js code so that I’ll be able to export an SVG file directly from my p5.js sketch.
Converting a PNG file that I took from my p5.js sketch into SVG using a third-party program (using this Adobe converter).
The first method did work in terms of exporting a snap of my sketch as an SVG file, but because my file was too big, I had to simplify my sketch a lot in order to make it successfully be exported as SVG like the following sketch:
The second method also worked, but but I couldn’t remove the background in Inkscape for some reason, for it exported with the black background included like this:
So I tried to manually remove snippets of the background, but it was too tedious and basically impossible to generate a completely clean sketch with my skills.
However, after discussing my SVG file code (the above embedded sketch) with professor Aya, we came to the conclusion that I can try to delete the perlin noise inside the circle while trying to maintain the other traces that perlin noise created for the lines, loops, ellipses, etc. For this I simply had to modify this snippet of code so that the below part is moved from function draw() to function setup():
background(0, 5); //the smaller the last number is, the longer the strokes stay visible + the slower the background color switches.
I also commented out the initial background drawing function I had in setup as well as the code that created the perlin noise pattern inside the circle:
//   // loop through each pixel inside the circle
//   for (let x = centerX - radius; x < centerX + radius; x++) {
//     for (let y = centerY - radius; y < centerY + radius; y++) {
//       let d = dist(x, y, centerX, centerY);

//       // check if the pixel = inside the circle
//       if (d < radius) {
//         // calculate Perlin noise value based on pixel's position
//         let noiseValue = noise(x * 0.01, y * 0.01);

//         // map the noise value to control the grayscale color
//         let gray = map(noiseValue, 0, 0.2, 50, 120);

//         stroke(gray); // stroke color
//         point(x, y); // draw a pixel at calculated position
//       }
//     }
//   }

  // noLoop(); // stop the draw loop after one frame
  //end of circle
After that, I modified the code so that both the “exploding” and “background flow field” ellipses will be smaller in quantity and size in hopes of decreasing the file size:
...

let particles1 = []; // exploding particles
let particles = []; // perlin noise flow field particles
const numParticles1 = 50; // exploding particles number
const numParticles = 500; // exploding particles number
const expansionLimit = 360; // Set your desired expansion limit

const num = 150; // flow field particles
const noiseScale = 0.01 / 2;
...
At this point, I had this sketch running that I was able to export into SVG successfully directly from p5.js!
This is also how it looked as an SVG file:
Although I had to make some adjustments, I was pretty happy with the amount of elements that I was able to keep. So afterwards, I set onto plotting my sketch on the pen plotter, which also took around two to three attempts because they kept stopping midway. Finally, for the last version, I decided to just try white paper and black pen because my sketch was pretty detailed and I didn’t want to risk eliminating those details using a white pen, which was less reliable compared to the black pens we had. It took way, way longer than I thought (two hours…), and I also had to change the pen midway because it ran out of ink, but it somehow worked and I’m very happy with the result:
I thought it’d be cool to list all the versions of the sketch that I made till my final product!
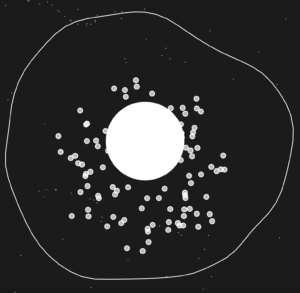
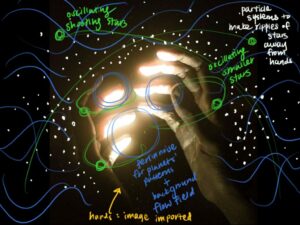
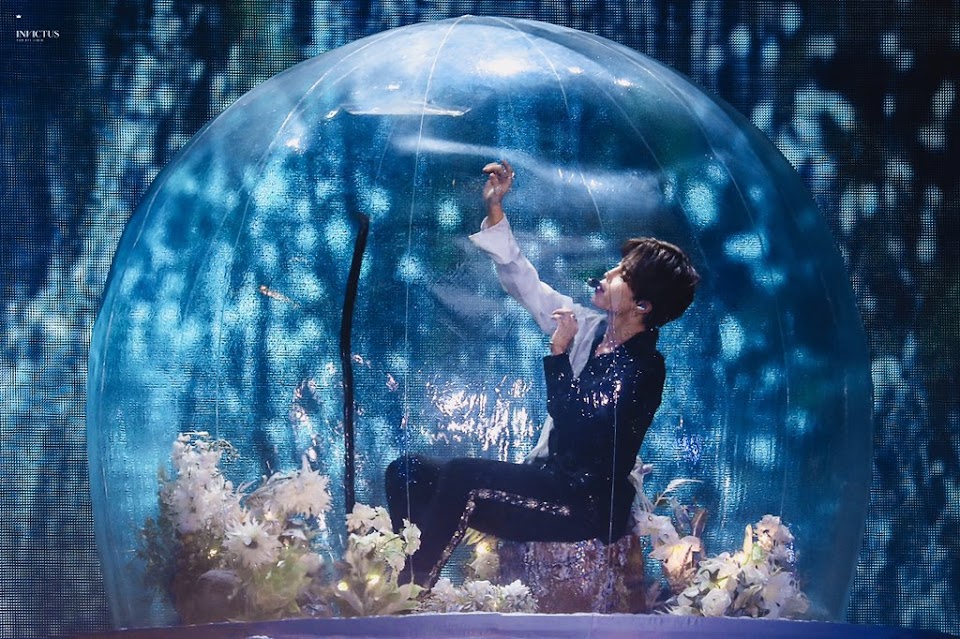
At first, I was leaning more towards the whole “universe in one’s palms” idea, hence the first sketch; however, after seeing this image from a performance, I kind of wanted to create a small “universe” that was kind of in a “bubble” with particle explosions and waves to showcase chaos that can be controlled yet randomized and unpredictable.
These are also some research/videos that I referred to throughout my project:
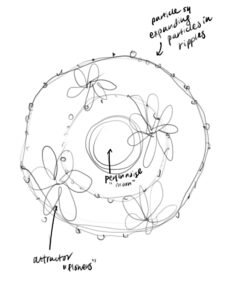
class PerlinShape — expanding circular waves; the patterns that a black hole generates (tutorial)
class particle — perlin noise flow field particles; symbolizes the small stars/shooting stars that we see passing by in the universe (tutorial)
class particle1 — explosion of particles; signifies big stars exploding/being generated in space (tutorial)
ellipse — has perlin noise pattern inside; the “moon”
Once I had this basic outline of how I wanted my sketch to look like, I was able to apply skills that I learned in class for each of them:
using perlin noise to create the surface of the planet (ellipse)
particle systems to make an “ripple” explosion of particles from the ellipse
using perlin noise to create a flow field for the background
2.
Then, I played around with the flow field and perlin noise as well as the direction change at mouse click.
3.
This was when I started to form a general idea of what kind of elements I’d specifically need, what kind of final product I wanted to achieve, etc., and I added the exploding particles and perlin noise ellipse in the middle.
4.
Then I began experimenting with combining perlin noise loop and the flow field background I already had, and although my initial idea was to only create one single line of perlin noise loop, I actually ended up liking this tracing of the loop that made it look like there’s multiple lines on canvas so I kept it.
5.
Then I combined all elements together and modified some elements (expansion limit of exploding particles, how long the traces will remain on canvas, etc.) — almost there to the end sketch!
6.
Finally, this is the end result of my code, in which I simply added a hand image at the bottom of the canvas — my very first idea was to create a smaller universe within two pairs of hands, and although I gave up on the idea because I made many modifications to my sketch since then, I still wanted to try implementing an image to combine it with a randomly generated art sketch even if it was only for my code and not my SVG sketch.
Link to code: https://editor.p5js.org/Clara0424/sketches/FLpwKaMgl
Reflection:
Here are some complications that I thought were significant during my process of creating this final sketch. These struggles were all documented in my previous posts, but I just wanted to make a compilation of them in one post so that it’s easier for me to identify and present.
Combining all elements (flow field background, perlin noise loops, perlin noise ellipse, exploding particles, hand image) and readjusting all of their positions. For example, readjusting my exploding particles to the center after adding the perlin noise loops took a long time for me to crack the code (used the code below to readjust the position).
let particle1 = new Particle1(width/2, height/2); // Set initial position of the explosion WITHIN the circle boundary
// Check if the particle has exceeded the expansion limit; controlling this elongates the ellipse boundary limit of the particles
if (dist(this.position.x*1, this.position.y*1, width/2, height/2) >= this.expansionLimit) {
  this.lifespan = 0;
}
display() {
  fill(255, this.lifespan);
  ellipse(this.position.x*1, this.position.y*1, 10, 10); // the position of the ellipse limit itself
}
2. SVG export (as mentioned above in this post) — I had many alterations, sketches, and experiments with the original code till the point where I was confused about which version is what, haha. The printing process itself was also a challenge not just because of the long hours it took but also because of the sudden pauses that disrupted my sketch from being plotted in one go.
However, I also had parts of my process/code that I was proud of, such as:
Using function mouseReleased() to reset the noise seed every time I release the mouse. By setting the noise seed to the current millisecond value, I was able to increase the randomization, variety, and designs of my sketch for all of my elements. The snippet of code I used for this is shown below:
function mouseReleased() {
  noiseSeed(millis());
}
2. Another element of my code that I’m particularly proud of is the PerlinShape.js class, which is the class that is responsible for generating the perlin noise loops in my sketch. Initially I didn’t expect there to be multiple loop lines, but although I implemented the code for just one loop it ended up generating multiple because of the perlin noise code that I already had in my sketch code. So it traced the movement of the loop, which gave this illusion that there’s multiple loops moving around fluidly. This look was something that I wanted to achieve but gave up on earlier on when I was brainstorming what to do for my project, so I was really happy to accidentally stumble upon it and create it for my final sketch.
Final Words:
As tedious, time-consuming, and challenging this project was, I genuinely learned so much about not just p5.js coding but also about pen plotters, creating an original work, and experimenting with randomization and rolling with the knowledge that you will likely discover something completely new and unexpected that might trigger your interest midway into the process of creating it, causing you to shift your whole idea for your project. As a planner who prefers knowing what my next steps will be, this was hard to accept at first, but by the end of the project, I ended up enjoying and even anticipating the new designs that I might end up with once I implemented the next snippet of my code. It was really rewarding to see your original creation come to life not just in p5.js but also on an actual paper! 🙂
I find that using your voice to create art can be interpreted in many ways. Several people take their experiences and perhaps even struggles and use art to voice their opinions. So while thinking of this idea of using your voice to make art, I began to wonder whether I can design a program to make generative art by using human voice, literally rather than figuratively…
I was wondering whether similar programs have been built before when I stumbled upon an article by Japanese artist Ryoji Ikeda, known for his innovative and contemporary work in the fields of sound art. His project , cyclo.id, in particular, caught my eye. His program focuses on creating circular patterns by the audio’s phase and amplitude and displaying it graphically.
However, I felt as if although the black and white combination really allows us the viewer to focus on the patterns, I personally think that a pop of color is much more fun! That when the idea of warm and cool colors came to my mind. I began to wonder, what if I could take the idea of generative audiovisual patterns, and associate this audio and specifically the volume level to cool and warm color shades. Here are a few pictures of contrasting warm and cool colors I looked at to gain inspiration for my color palette.
Concept:
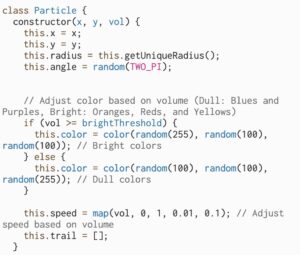
The SoundWave Constructor is a program that generates an interactive art piece that dynamically responds to audio input from the computer’s microphone every time the program is ran. Every time the user makes noise, the program stores the volume level, and also instantiates a particle every time through the Particle class.
Interestingly, several of the components/attributes of the particle will directly depend on the volume level. For instance, the color of the particle and its trace will depend on whether the volume recorded at that second by p5 is higher or lower than the Threshold. The color of the instantiated particle would be closer to the warmer colors such as the reds, yellows and oranges when the volume recorded is higher than the threshold and closer to the cooler colors such as the blues, purples and greens when the volume recorded is lower than the threshold.
Other factors that depend on the volume include the speed of orbit and the radius of orbit of the particle, and the same idea applies as well, higher/lower volumes constitute to faster/slower speed and larger/smaller radius respectively. I will explain these methods and their implementations in depth in the Code section of this blog post.
How it Started:
The initial Idea I had in mind was creating almost a digital and audiovisual record player. The way I did that was through creating a very similar particle system and continuously instantiating ellipse particles that also left a trail. Follow along for short descriptions/displays of several programs I tried out before I got to the final program.
At first, I mainly focused on the instantiation of particles from the particle system. Not focusing on colors, nor speeds, my program lacked a pop of color, but also lacked that generative and creative aspect. Here’s how it looked at that stage:
Next thing I worked on was making sure that based on the volume, the speed of the instantiated particle was determined, and the color as well. Higher volume, faster speed, and brighter colors, lower volume, slower speed, and more dull colors. Snippets of this code and further explanation will be included in the code section.
Once I got the speed and color covered, I began to wonder how much more can I push the generative aspect of this program? I began to think of this especially because I noticed that the behavior of these particles are very predictable, and that defies the purpose of generative art! Thats when I began to wonder, how can I play around with trigonometric functions and audio input to make the art less predictable.
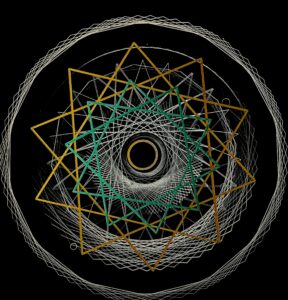
I mainly used trig values to computer the vector’s x and y, and also as part of the particles speed. The way I got the sketches bellow was by randomly switching around the trig values, and also experimenting with rational functions to see the different patterns. Here were a few sketches .
Here are a few sketches I got after fully developing the program:
Tackling Challenges:
The main challenges I faced included editing my code so that it can save an SVG file to be printed on the x, y plotter. At first the SVG would save however it would not open on inkscape. I kept trying various variations in order to get an SVG file that opens on inkscape, but most of them either ran errors or simply did not open.
After following the exact steps on the powerpoint presentation, and revising the syntax for mouse pressed, in addition to trials and errors, I was able to capture an SVG file that looked exactly like my program, and also captured the several layers of the particles and their trails, which was ideal for the printing.
Other challenges I faced included trying to pick which trig value to use as a parameter for vectors’ x and y values, as well as the angle. Playing around with the different trig values gave me several types of patterns, and each combination of trig functions gave a completely different pattern all of which were generative and looked very interesting. It was very difficult to pick one specific pattern, but I found that the combination I used in my final code was very visually pleasing.
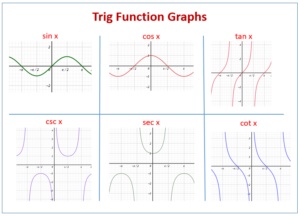
To better visualize take a look at the various trig function and their graphs over their period:
One more challenge I faced is leaving the trail on the leading particle. I initially made the leading particle an ellipse, however, I reduced the ellipses size by giving it radius of zero in order to create an illusion of an invisible leading particle. To figure out how to leave the trace, I looked into the update method, and also the create vector method, and combined both to store into the trail history list.
Snippets of Code:
Using Particle System:
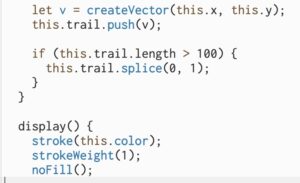
The Particle class is responsible for the individual particles. Each particle is created with a unique radius and a random starting angle, which is then manipulated with other trig functions. The color of the particle is determined based on the volume of the microphone input, with brighter colors for higher volumes. The speed of the particle is also adjusted based on the volume. The position of the particle is updated in the update method, and the path is recorded in the trail array. The display method draws the trail and a very small ellipse, which does not show as its meant to lead the trail, at the current position of the particle.
The ParticleSystem class is responsible for handling a collection of particles. In the update method, it calculates the number of particles to add based on the microphone volume and creates new particles at the specified location. If the number of particles is more than a certain threshold, which is 50 particles, older particles are removed. The display method updates and displays each particle in the system.
Managing Path Direction Through Vectors:
A vector v is created using createVector(this.x, this.y) and it represent the current position of the particle.The vector is then appended to the array this.trail to record the path of the particle. This trail array stores the positions of the particle over time, which later is used to draw the path.The display method of the Particle class uses the this.trail array to draw the path of the particle by connecting the recorded positions using vertex calls, creating a visual trail.
Trigonometric Functions Patterns:
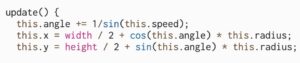
In the update method, the particle’s new x and y coordinates are calculated using trigonometric functions cos and sin. These functions use the this.angle and the particle’s this.radius to get the new position. This.x is calculated as width / 2 + cos(this.angle) * this.radius, which moves the particle horizontally based on the cosine of the angle.this.y is calculated as height / 2 + sin(this.angle) * this.radius, which moves the particle vertically based on the sine of the angle.
FINAL Product:
Note: Please make sure to enable your mic and allow access to run the program using user audio, the link of the program is attached below.
Creating this p5 program was a very enlightening and fun journey, I most importantly learned how to take the examples, and concepts learned in class and integrate them with one another to create a program that makes generative art. What I enjoyed the most was really trying out all the variations of trig functions I could use to make different patterns, because it allowed me to really visualize how big of an impact switching trig functions can have on our parameters which was the speed and angle.
Although I am satisfied with how my program turned out, I really look forward to further advancing this code and improving certain aspects such as working with more complicated trig functions and visualizing other potential patters. Or perhaps having several different types of particles behave is various ways rather than just one particle in a particle system.


 challenging part was dealing with the SVG files, as for some reason particles would extend outside the canvas in the exported SVG file, which did not show up in the P5.js sketch. This became complicated as there were no borders and the Pen Plotter would catch the edge of the paper and thus it took a couple of tries to plot the sketch right. I used the version of my sketch that only had the white lines to export the SVG files. That version of code also had an altered Particle class that saved the previous position and would draw a line between previous and current positions rather than an ellipse at a current position. (I removed the SVG code from the sketch so that the code runs faster, but apart from that and the canvas size, nothing else was altered).