Final Project: Kinetic Personalities

Concept

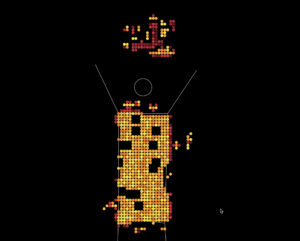
My project serves as a metaphor for the ever-changing nature of human identity and the many facets that constitute an individual. Inspired by the dynamic principles of cellular automata, the project visualizes a grid of cells that continuously transition between phases of life and dormancy, mirroring the fluidity of human existence. Each cell represents a different element of one’s personality, similar to the various roles, hobbies, and experiences that define a person at a certain point in time. The periodic interplay of dying and born cells encapsulates the core of personal development and adaptability over time.

Video Demonstration

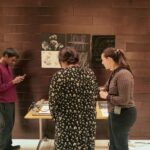
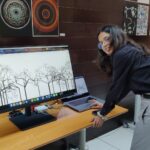
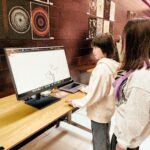
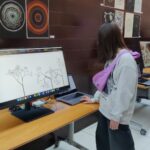
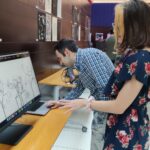
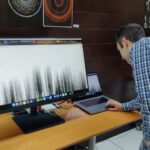
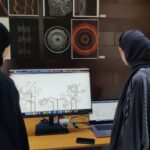
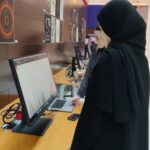
Images
Interaction Design

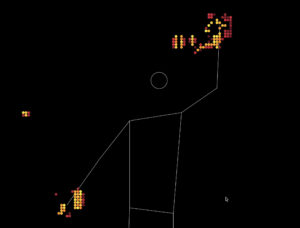
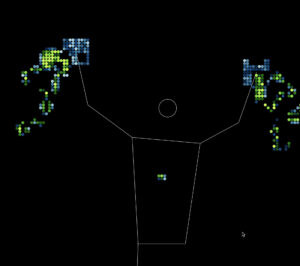
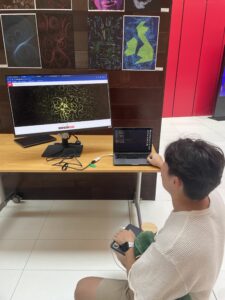
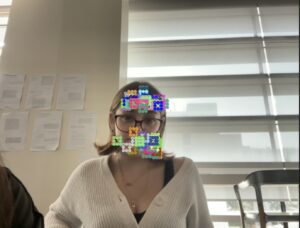
I crafted the interaction design to be both intuitive and playful, encouraging whole-body engagement. A key goal was to instill an element of discoverability and surprise within the user experience. For instance, the skeleton dynamically lights up when wrists are drawn near, while the color palette transforms as the wrists move apart. This intentional design seeks to not only captivate users but also symbolize a broader narrative—the idea that individuals possess the inherent power to shape and sculpt their own personalities, paralleling the dynamic changes observed in the visual representation. More about the interaction design was discovered during the user testing, described below.

User Testing

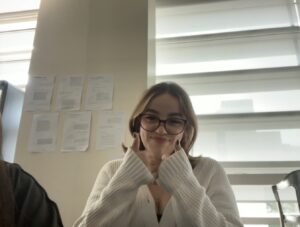
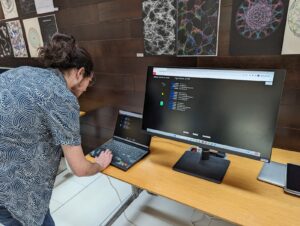
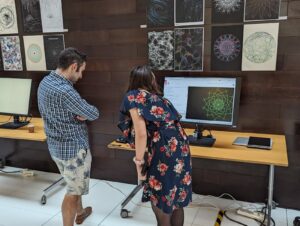
User Testing was a crucial stage in the development of my project. Observing and hearing people’s expectations and frustrations while using my project helped to see the goals of my project more clearly.

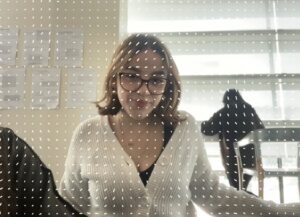
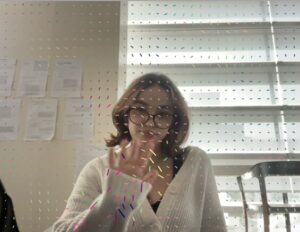
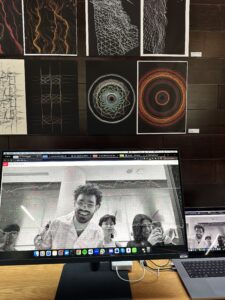
For instance, at first I was thinking not to include a human skeleton figure mimicking the participant, and I was considering the option of a black and white video display. Participants were more fond of the video as it allowed them to get visual feedback of their pose and how their actions are perceived by the camera. Since video display was a little too distracting for the eye, but visual feedback of participant’s pose was desired, my solution was including an abstract skeleton figure by taking advantage of the ml5.js library.

An additional valuable observation emerged in relation to event design. Initially, I had one event set the event trigger to activate cells within the skeleton when wrists came close. While contemplating potential actions for triggering another event, a participant proposed that an intuitive approachwould be activating the second event when hands were stretched apart. Taking this insightful suggestion into account, I subsequently integrated the color change mechanism to occur when the distance between wrists was wide.

Here is a video of the final user testing:

Code Design

The code utilizes of the p5.js and ml5.js libraries to create a cellular automata simulation that reacts to a user’s body movements filmed via a webcam. The ml5 PoseNet model gathers skeletal data from the video feed of the user and identifies major body parts. The activation of cells in a grid is influenced by the positions of the wrists. The grid symbolizes a cellular automata, in which cells evolve according to predefined rules. The user’s wrist movements activate and deactivate cells, resulting in complicated patterns. The project entails real-time translation, scaling, and updating of the cellular automata state, resulting in an interactive and visually pleasant experience that combines cellular automata, body movement, and visual aesthetics.

One of the key parts regarding code was correctly calculating the indices of the cells that need to be activated based on the video ratio. I decided that a 9×9 grid gave the best visual result, here is my code for the activation of cells on the left wrist:

let leftWristGridX = floor(
      ((pose.leftWrist.x / video.width) * videoWidth) / w
    );
    let leftWristGridY = floor(
      ((pose.leftWrist.y / video.height) * videoHeight) / w
    );

    // Activate cells in a 9x9 grid around the left wrist
    for (let i = -4; i <= 4; i++) {
      for (let j = -4; j <= 4; j++) {
        let xIndex = leftWristGridX + i;
        let yIndex = leftWristGridY + j;

        // Check if the indices are within bounds
        if (xIndex >= 0 && xIndex < columns && yIndex >= 0 && yIndex < rows) {
          // Set the state of the cell to 1 (activated)
          board[xIndex][yIndex].state = 1;
        }
      }
    }

Another key part was the events. Here is the code for the color switch event:

// Creating an event to change colors
    let wristsOpen =
      dist(leftWristGridX, leftWristGridY, rightWristGridX, rightWristGridY) >
        60 &&
      dist(leftWristGridX, leftWristGridY, rightWristGridX, rightWristGridY) <
        80;

    if (wristsOpen) {
      // Activate the event for all existing cells
      for (let i = 0; i < columns; i++) {
        for (let j = 0; j < rows; j++) {
          board[i][j].event = true; // responsible for coloir change in Cell class
        }
      }
    } else {
      // Deactivate the event for all existing cells
      for (let i = 0; i < columns; i++) {
        for (let j = 0; j < rows; j++) {
          board[i][j].event = false;
        }
      }
    }

Nevertheless, probably the biggest challenge was the accurate full-screen display. I utilized additional functions to handle that, which required to re-initialize the board once the dimensions of the screen changed.

Another important function was deactivateEdgeCells() functions. For some reason (probably because of a different number of neighbors), the edge cells would not deactivate as the rest of the cells once a wrist crossed them. Therefore, I used an additional function to handle the issue that loops through the edge cells and sets their state to 0 if they were activated:

function deactivateEdgeCells() {
  for (let i = 0; i < columns; i++) {
    for (let j = 0; j < rows; j++) {
      // Check if the cell is at the edge and active
      if (
        (i === 0 || i === columns - 1 || j === 0 || j === rows - 1) &&
        board[i][j].state === 1
      ) {
        board[i][j].state = 0; // Deactivate the edge cell
      }
    }
  }
}
Sketch

Future Improvements

Here is a list of possible further implementations:

  • Music Integration: The addition of music could enhance the overall experience, encouraging more movement and adding a playful dimension to the interaction.
  • Dance: Exploring the combination of the sketch with a live dance performance could result in a unique and captivating synergy of visual and kinesthetic arts.
  • Multi-User Collaboration: Sketch is currently supporting interaction for one person. Expanding the sketch to accommodate multiple users simultaneously would amplify the playfulness and enrich the collaborative aspect of the experience.
  • Additional Events: one event that I would have loved to explore further was the change in CA rules that generated a beautiful pattern expanding through the whole canvas. I believe it would make the sketch more dynamic.
  • Events on more advanced poses: Involving the legs or the head movements could make the project more intricate and add to the discoverability and surprise aspects.
Resources

A key element was the use of the ml5.js library, for the implementation of which I was relying on Daniel Shiffman’s tutorials.

The CA rules were a happy accident which I discovered when I was experimenting in my CA weekly assignment.
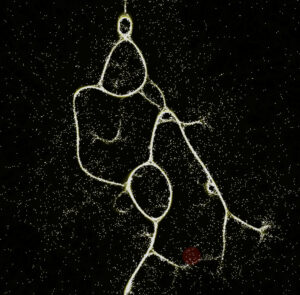
IM Show Documentation

Final Project: Many Worlds

Concept

At the heart of my final project lies an ambitious vision: to visually explore and simulate the fascinating theories of multiverses and timelines in physics. This journey, powered by p5.js, delves into the realm where science meets art, imagining our universe as merely one among an infinite array of possibilities. The project captures the essence of the multiverse theory, the many-worlds interpretation, timeline theory, and the intriguing butterfly effect, presenting a dynamic canvas where every minor decision leads to significant, visible changes.

Images

User Testing

Implementation

Description of Interaction Design

Initial User Engagement: Upon launching the simulator, users are greeted with an informative popup window. This window sets the stage for their cosmic journey, outlining their role in crafting universes and navigating timelines. It provides clear instructions on how to interact with the simulation, ensuring users feel comfortable and engaged from the outset.

Canvas Interaction:

  • Creating Timelines: The primary interaction on the canvas is through mouse clicks. Each click places a gravitational point, the inception of a new timeline. This action leads to the emergence of diverging lines, symbolizing the branching of timelines in the multiverse.
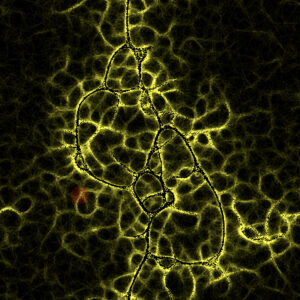
  • Timeline Dynamics: The lines stemming from each point spread across the canvas, intertwining to form a complex network of timelines. This visualization represents the ever-evolving nature of the universe, with each line’s path shaped by random divergence, creating a unique multiverse experience.
  • Dimensional Shifts: The use of arrow keys allows users to shift dimensions. Pressing the ‘Up’ arrow key transforms the lines into particle-like forms with a whiter hue, representing the dual nature of light as both particle and wave. This shift is a metaphor for viewing the cosmos from a different dimensional perspective. Conversely, the ‘Down’ arrow key reverts these particles into their original line state, symbolizing a return to the initial dimension.

Customization and Control:

  • Radius and Decay Parameters: Users can adjust the radius of the gravitational points and the decay rate of the timelines. These parameters influence the behavior of the timeline strings, allowing for a more personalized and interactive experience.
  • Interactive Buttons:
    • Clear Button: Resets the canvas, clearing all timelines and providing a fresh start.
    • Random Button: Randomizes the radius and decay parameters, introducing an element of unpredictability.
    • Update Button: Applies changes made to the radius and decay settings, updating the canvas accordingly.
  • Precise Editing: By holding the shift key and clicking, users can erase specific parts of the timelines, allowing for detailed adjustments and creative control.

This design not only immerses users in the concept of multiverses but also offers an intuitive and engaging way to visualize complex physics theories. Through simple yet powerful interactions, the Multiverse Simulator becomes a canvas where science, art, and imagination converge.

Technical implementation side

Key Steps in Particle Simulation:

  1. Sense: Each particle senses its environment in a unique way, employing three sensors to detect the surroundings based on its heading direction.
  2. Rotate: The particle’s rotation is determined by the sensor readings, allowing it to navigate through the canvas in a realistic manner.
  3. Move: After determining its direction, the particle moves forward, creating a path on the canvas.
  4. Deposit: As particles move, they leave a trace in the form of yellow pixels, marking their journey.
  5. Diffuse: The trail left by each particle expands to the neighboring cells, creating a more extensive network of lines.
  6. Decay: The brightness of each pixel gradually fades, simulating the decay effect over time.

Code Snippets

The core functionality of the project is encapsulated in several key functions:

  • Particle Sensing and Movement:
function sense() {
  // The sense function is responsible for the decision-making process of each particle.
  // - It uses three sensors (left, center, right) to detect the environment ahead of the particle.
  // - Based on the sensor readings, the particle decides whether to continue straight, turn left, or turn right.
  // - This decision influences the particle's path, creating intricate patterns on the canvas as particles avoid their own trails.
  for (let i = 0; i < particles.length; i++) {
    let options = [0, 0, 0];
    options[1] =
      attracters[
        modifiedRound(particles[i][0] + SO * cos(particles[i][2]), "x")
      ][modifiedRound(particles[i][1] + SO * sin(particles[i][2]), "y")];
    options[0] =
      attracters[
        modifiedRound(particles[i][0] + SO * cos(particles[i][2] + SA), "x")
      ][modifiedRound(particles[i][1] + SO * sin(particles[i][2] + SA), "y")];
    options[2] =
      attracters[
        modifiedRound(particles[i][0] + SO * cos(particles[i][2] - SA), "x")
      ][modifiedRound(particles[i][1] + SO * sin(particles[i][2] - SA), "y")];
    if (options[1] >= options[2] && options[1] >= options[0]) {
      continue;
    } else if (options[0] > options[2]) {
      particles[i][2] = (particles[i][2] + RA) % TWO_PI;
    } else if (options[0] < options[2]) {
      particles[i][2] = (particles[i][2] - RA) % TWO_PI;
    } else {
      let rand = Math.random();
      if (rand < 0.5) {
        particles[i][2] = (particles[i][2] + RA) % TWO_PI;
      } else {
        particles[i][2] = (particles[i][2] - RA) % TWO_PI;
      }
    }
  }
}
  • Canvas Interaction:

    function canvasClick() {
      // This function handles user interactions with the canvas.
      // - If the SHIFT key is held down while clicking, it removes particles within the click radius.
      // - If the ENTER key is held, it adds a new emitter at the mouse location.
      // - Otherwise, it spawns new particles around the click location within the specified radius.
      // Each particle is initialized with a random direction.
      if (keyIsDown(SHIFT)) {
        const notRemoved = [];
        for (let xs of particles) {
          if (
            Math.sqrt((mouseX - xs[0]) ** 2 + (mouseY - xs[1]) ** 2) > clickRadius
          ) {
            notRemoved.push(xs);
          }
        }
        particles = notRemoved;
      } else if (keyIsDown(ENTER)) {
        emitters.push([mouseX, mouseY]);
      } else {
        for (
          let i = 0;
          i < particlesPerClick && particles.length < maxParticles;
          i++
        ) {
          let dis = clickRadius * Math.random();
          let ang = TWO_PI * Math.random();
          let x = mouseX + dis * cos(ang);
          let y = mouseY + dis * sin(ang);
    
          particles.push([x, y, TWO_PI * Math.random()]);
        }
      }
    }
  • Decay:

    function decay() {
      // This function manages the decay and diffusion of particle trails.
      // It updates the visual representation of each particle's trail on the canvas.
      // - First, it iterates over the canvas, applying the decay factor to reduce the brightness of trails.
      // - Then, it applies a blur filter (simulating diffusion) to create a smoother visual effect.
      // - Finally, the attracters array is updated based on the decayed and diffused pixel values.
      for (let i = 0; i < imageWidth; i++) {
        for (let j = 0; j < imageHeight; j++) {
          writePixel(at, i, j, attracters[i][j]);
        }
      }
      at.filter(BLUR, diffK);
      for (let i = 0; i < imageWidth; i++) {
        for (let j = 0; j < imageHeight; j++) {
          attracters[i][j] = at.pixels[(i + j * imageWidth) * 4] * decayT;
        }
      }
      at.updatePixels();
    }

    Aspects of the Project I’m Particularly Proud Of

    Reflecting on the development of the Multiverse Simulator, there are several aspects of this project that fill me with a sense of pride and accomplishment:

    1. Complex Algorithm Implementation: The heart of this project lies in its complex algorithms which simulate the behavior of particles in a multiverse environment. Successfully implementing and fine-tuning these algorithms — particularly the sensing, rotating, moving, depositing, diffusing, and decaying behaviors of particles — was both challenging and rewarding. The intricacy of these algorithms and how they bring to life the concept of timelines and multiverses is something I am exceptionally proud of.
    2. Interactive User Experience: Designing an interactive canvas where users can directly influence the creation and evolution of timelines was a significant achievement. The fact that users can engage with the simulation, spawning and altering timelines through intuitive mouse interactions, adds a dynamic layer to the project. This level of interactivity, where each user’s actions uniquely shape the cosmos they’re exploring, is particularly gratifying.
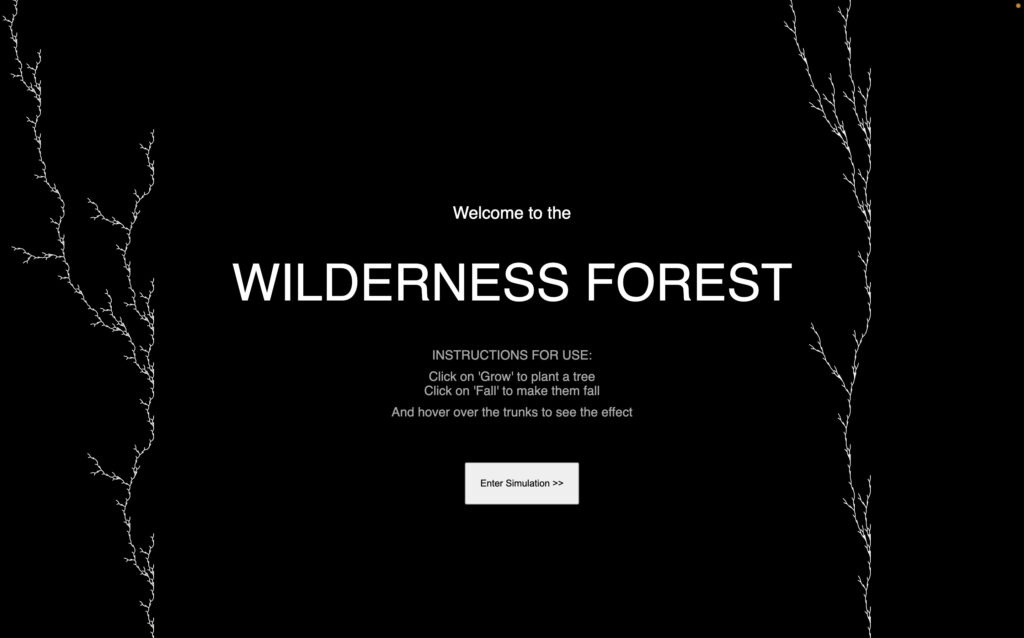
    3. Visual Aesthetics and Representation: The visual output of the simulation is another aspect I take great pride in. The way the particles move, interact, and leave trails on the canvas has resulted in a visually captivating experience. The transition between states — from lines to particles and back, depending on user interaction — not only serves as an artistic representation of the multiverse concept but also adds a profound depth to the visual experience.
    4. Optimizing Performance: Tackling the computational challenges and optimizing the simulation to run smoothly was a significant hurdle. Achieving a balance between the visual complexity and maintaining performance, especially when dealing with thousands of particles and their interactions, was a rewarding challenge. The fact that the simulator runs efficiently without compromising on the intricacies of its visual representations is a testament to the effectiveness of the optimization strategies employed.
    5. Educational Value: The project is not just an artistic endeavor; it’s also an educational tool that visually demonstrates complex physics theories in an accessible and engaging way. Bridging the gap between complex scientific concepts and interactive visual art to create a learning experience is an achievement that adds a lot of value to this project.

Links to Resources Used

In the journey of creating the Multiverse Simulator, various resources played a crucial role in guiding the development process, providing technical knowledge, and inspiring creativity. Here’s a list of some key resources that were instrumental in the project:

  1. Particle System Tutorials:
    • The Nature of Code by Daniel Shiffman: This book and its accompanying videos offer an in-depth look at simulating natural systems using computational models, with a focus on particle systems that was particularly relevant to this project.
  2. Physics and Multiverse Theory:
    • Multiverse Theory Overview: An academic article providing a detailed explanation of the multiverse theory, which helped in ensuring the scientific accuracy of the simulation.
    • Introduction to Quantum Mechanics: Articles and resources that offer a beginner-friendly introduction to quantum mechanics, aiding in conceptualizing the project’s scientific foundation.
  3. Coding Forums and Communities:
    • Stack Overflow: A vital resource for troubleshooting coding issues and learning from the experiences and solutions shared by the coding community.
    • Reddit – r/p5js: A subreddit dedicated to p5.js where developers and enthusiasts share their projects, tips, and ask questions.
  4. Performance Optimization:
    • Web Performance Optimization: Guidelines and best practices from Google Developers on optimizing web applications, which were crucial in enhancing the simulator’s performance.
  5. Software Development Best Practices:
    • Clean Code by Robert C. Martin: A book that offers principles and best practices in software development, guiding the structuring and commenting of the code for this project.

Demo

Full source code

Challenges Faced and How They Were Overcome

The development of the Multiverse Simulator presented several challenges, each demanding creative solutions and persistent effort. Here’s a look at some of the key hurdles encountered and the strategies employed to overcome them:

  1. Complex Algorithm Integration:
    • Challenge: Implementing the complex algorithms that simulate particle behaviors and interactions was a daunting task. Ensuring these algorithms worked in harmony to produce the desired visual effect required a deep understanding of both programming and physics.
    • Solution: To address this, I spent considerable time researching particle systems and physics theories. Resources like “The Nature of Code” were instrumental in gaining the necessary knowledge. Additionally, iterative testing and debugging helped refine these algorithms, ensuring they functioned as intended.
  2. Performance Optimization:
    • Challenge: The simulator’s initial iterations struggled with performance issues, particularly when handling a large number of particles. This was a significant concern, as it impacted the user experience.
    • Solution: Performance optimization was tackled through several approaches. Code was profiled and refactored for efficiency, unnecessary computations were minimized, and the rendering process was optimized. Learning from online resources about efficient canvas rendering and adopting best practices in JavaScript helped immensely in enhancing performance.
  3. User Interface and Experience:
    • Challenge: Creating an intuitive and user-friendly interface that could accommodate the complex functionalities of the simulator was challenging. It was essential that users could easily interact with the simulation without feeling overwhelmed.
    • Solution: The design of the user interface was iteratively improved based on user feedback and best practices in UI/UX design. Simplicity was key; the interface was designed to be minimal yet functional, ensuring that users could easily understand and use the various features of the simulator.
  4. Balancing Artistic Vision with Technical Feasibility:
    • Challenge: One of the biggest challenges was aligning the artistic vision of the project with technical constraints. Translating complex multiverse theories into a visually appealing and scientifically accurate simulation required a delicate balance.
    • Solution: This was achieved by continuously experimenting with different visual representations and consulting resources on generative art. Collaboration with peers and seeking feedback from artistic communities also provided fresh perspectives that helped in making the simulation both aesthetically pleasing and conceptually sound.
  5. Debugging and Quality Assurance:
    • Challenge: Given the complexity of the simulation, debugging was a time-consuming process. Ensuring the quality and reliability of the simulation across different platforms and devices was critical.
    • Solution: Rigorous testing was conducted, including unit testing for individual components and integrated testing for the overall system. Community forums like Stack Overflow were invaluable for resolving specific issues. Cross-platform testing ensured the simulator’s consistent performance across various devices.

Future Improvement Opportunities

Reflecting on the Multiverse Simulator’s journey, there are several areas where the project can be further developed and enhanced. Future improvements will focus on expanding its capabilities, refining user experience, and exploring new technological frontiers:

  1. Advanced User Interactions:
    • Enhancement: Introducing more sophisticated interaction methods, such as gesture recognition or touch-based inputs, could provide a more immersive experience. Integrating virtual or augmented reality elements could also take user engagement to a whole new level.
    • Implementation: Researching emerging technologies in AR/VR and experimenting with libraries that support these features could be the next steps in this direction.
  2. Richer Visual Effects:
    • Enhancement: Enhancing the visual aspects of the simulator with more detailed and diverse effects could make the experience even more captivating. Implementing additional visual representations of quantum phenomena could deepen the scientific authenticity of the project.
    • Implementation: Experimenting with advanced graphics techniques and shaders could provide a wider range of visual outputs, adding depth and variety to the simulation.
  3. Scalability and Performance:
    • Enhancement: Further optimizing the simulation for scalability to handle an even larger number of particles without performance loss would be beneficial. This could allow for more complex simulations and a richer visual experience.
    • Implementation: Leveraging web workers and exploring parallel processing techniques could improve performance. Profiling and optimizing current code to reduce computational overhead can also be continued.
  4. Educational Integration:
    • Enhancement: Developing an educational module that explains the underlying scientific concepts in an interactive manner could transform the simulator into a powerful learning tool.
    • Implementation: Collaborating with educators and scientists to create informative content and interactive lessons could help in integrating this feature.
  5. Community and Collaboration:
    • Enhancement: Building a community platform where users can share their creations, exchange ideas, and collaborate on simulations could foster a more engaged user base.
    • Implementation: Implementing social sharing features and community forums, along with user accounts for saving and sharing simulations, could help build this community.
  6. Accessibility and Inclusivity:
    • Enhancement: Ensuring the simulator is accessible to a diverse audience, including those with disabilities, can make the experience more inclusive.
    • Implementation: Adhering to web accessibility standards, incorporating features like screen reader compatibility, and providing different interaction modes for users with different needs are crucial steps.
  7. Feedback and Iterative Improvement:
    • Enhancement: Regularly collecting user feedback and iteratively improving the simulator based on this feedback can ensure that it continues to meet and exceed user expectations.
    • Implementation: Setting up feedback mechanisms, conducting user testing sessions, and regularly updating the simulator with improvements and new features.

IM Show

Xiaozao Wang – Final Project

Project Title: Morphing the Nature

Source code: https://github.com/XiaozaoWang/DNFinal

Video trailer:

A. Concept:

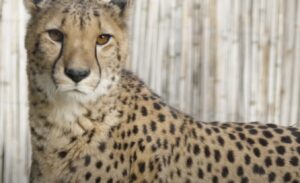
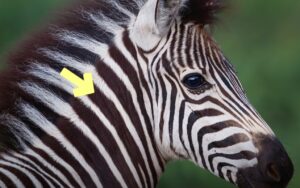
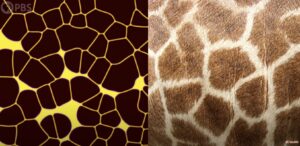
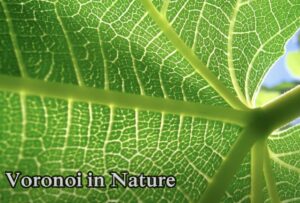
Similar patterns have been found in animal bodies, plants, and even landscapes. This shows us that maybe things in nature share the same basic algorithm to form their body, including the humans. However, with the development of technology, we think that we have control over other beings and nature, and begin to forget that nature’s wisdom is inherent in our own bodies all the time.

I want to visually explore patterns found in nature and overlay them to the viewer’s figure in the computer through their webcam. Through this project, I aim to promote awareness of our interconnectedness with nature and other living beings. While humans have developed great abilities, we remain part of the natural world that we evolved from. We should respect and learn from nature rather than try to exploit it.

B. Design and Implementation

My project consists of two main parts: 

  1. Generating the patterns based on the mathematical principle behind them.
  2. Capturing the user’s figure using the camera and morphing the patterns onto the figure.

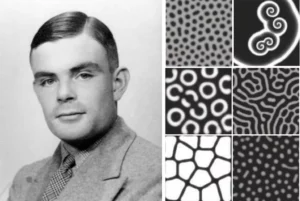
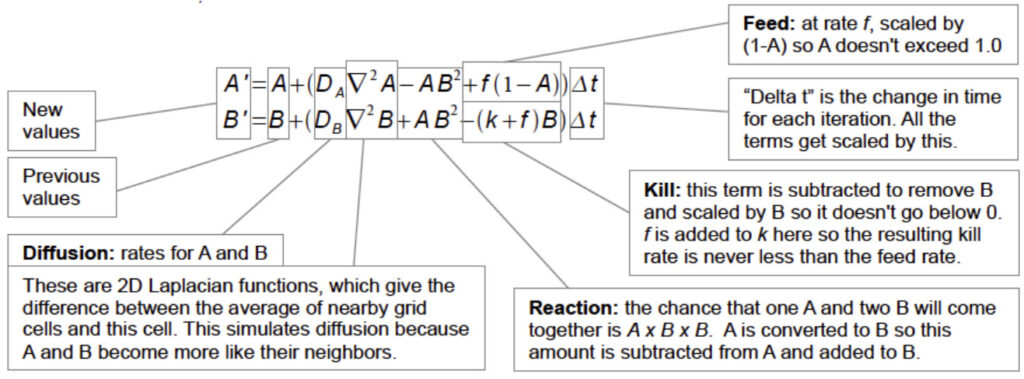
I used Turing’s Reaction-Diffusion Model as the blueprint for generating the patterns. That’s because this model shows how different patterns in nature, from stripes to spots, can arise naturally from a homogeneous state. It is based on the interplay between two kinds of chemicals: the Activator and the Inhibitor, where the activator is trying to reproduce and the inhibitor is stopping it from doing so. Different generating and dying rates of these chemicals create a variety of interesting behaviors that explain the mystery of animal/plant patterns.

I mainly referred to Karl Sims’s version of the reaction-diffusion equation. He has a wonderful research and web art project about Turing’s pattern. https://www.karlsims.com/rd.html

I also learned about ways to translate this equation into code from the coding train: https://youtu.be/BV9ny785UNc?si=aoU4__mLw6Pze6ir

grid[y][x].a = a +
        ((dA * laplaceA(x, y)) -
        (a * b * b) +
        (feed * (1 - a))) * 1;
      grid[y][x].b = b +
        ((dB * laplaceB(x, y)) +
        (a * b * b) -
        ((k + feed) * b)) * 1;

I created a class that stores the concentration of Chemicals A and B of every pixel in the 2D array.

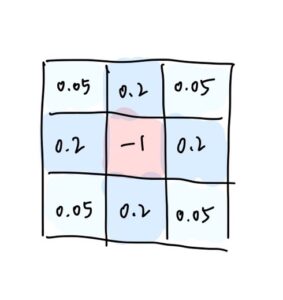
One of the interesting parts is that the “diffusion” part works similarly to the Game of Life. In every update, the new concentration of the center pixel of a 3×3 convolution is calculated based on the concentration of its 8 neighbors, each with a different weight. This causes the chemicals to diffuse into areas around them. In our case, the weights are as follows.

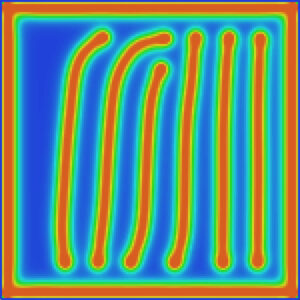
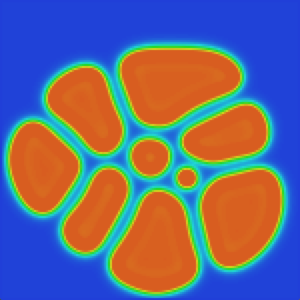
There are results like this:

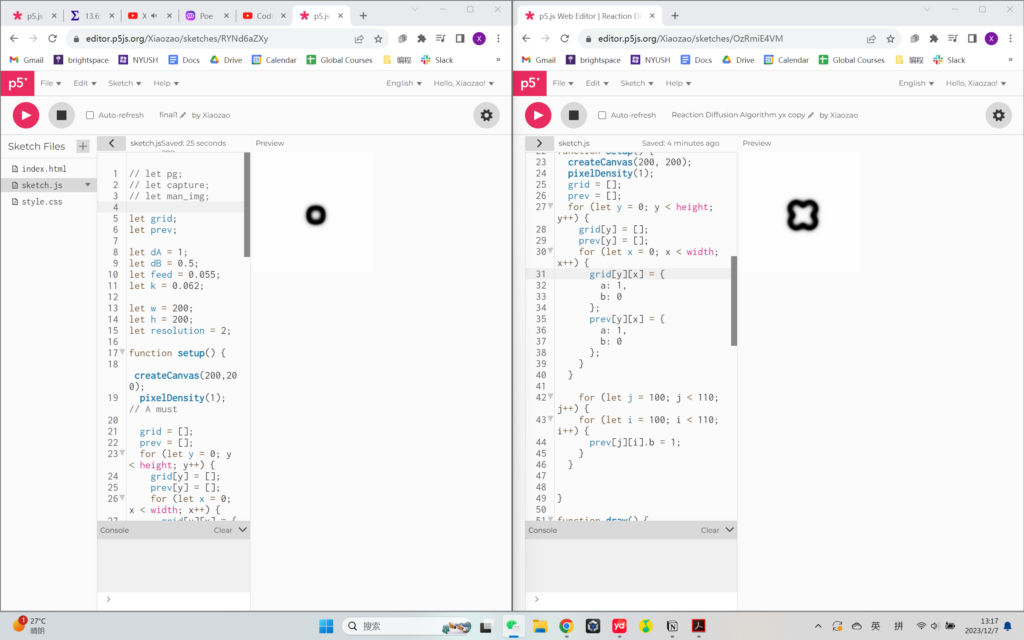
However, one thing is that the complicated calculations slow down the running of the sketches, and making the canvas bigger also results in lagging. After testing, I found that the p5js library is causing the problem (because it’s a rather large library).

As you can see, even the difference between using the p5 file and the p5.min file can cause such a huge difference in running efficiency: (They both start from the same seed. The one on the right is using p5.min, and runs twice as fast as the one on the left)

Therefore, I decided to use Processing as the platform to develop my project. It is a local software therefore doesn’t have to fetch the library from the web.

Moreover, I reduced the resolution of the canvas by utilizing 2D arrays. (In the webcam part, I also reduced the resolution by storing the information of only the top-left pixel out of an 8×8 pixel grid). By doing this, I was able to expand the canvas size.

Then it comes to the next step: Capturing the user’s figure with the webcam and projecting the patterns on the figure.

This is the logic of implementation:

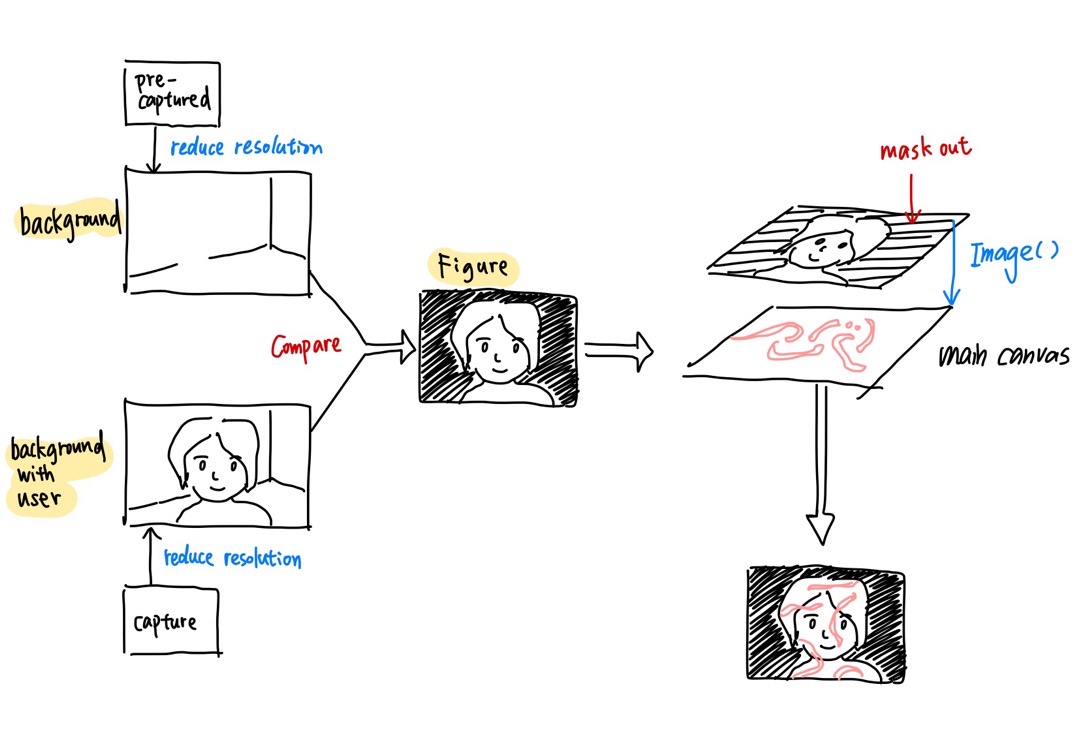
Firstly, we will need to capture an empty background without any humans, and store the color data in a 2d array. Then we will compare the real-time video captured by the webcam with that empty background, and identify the areas that have large color differences. ( I used the Euclidean distance) These areas will represent where the figure is. And then, we use this precessed layer as a map that controls which part of the pattern layer is shown to the user. Then, we will be able to see that the patterns are only growing on the user’s figure but not on the background!

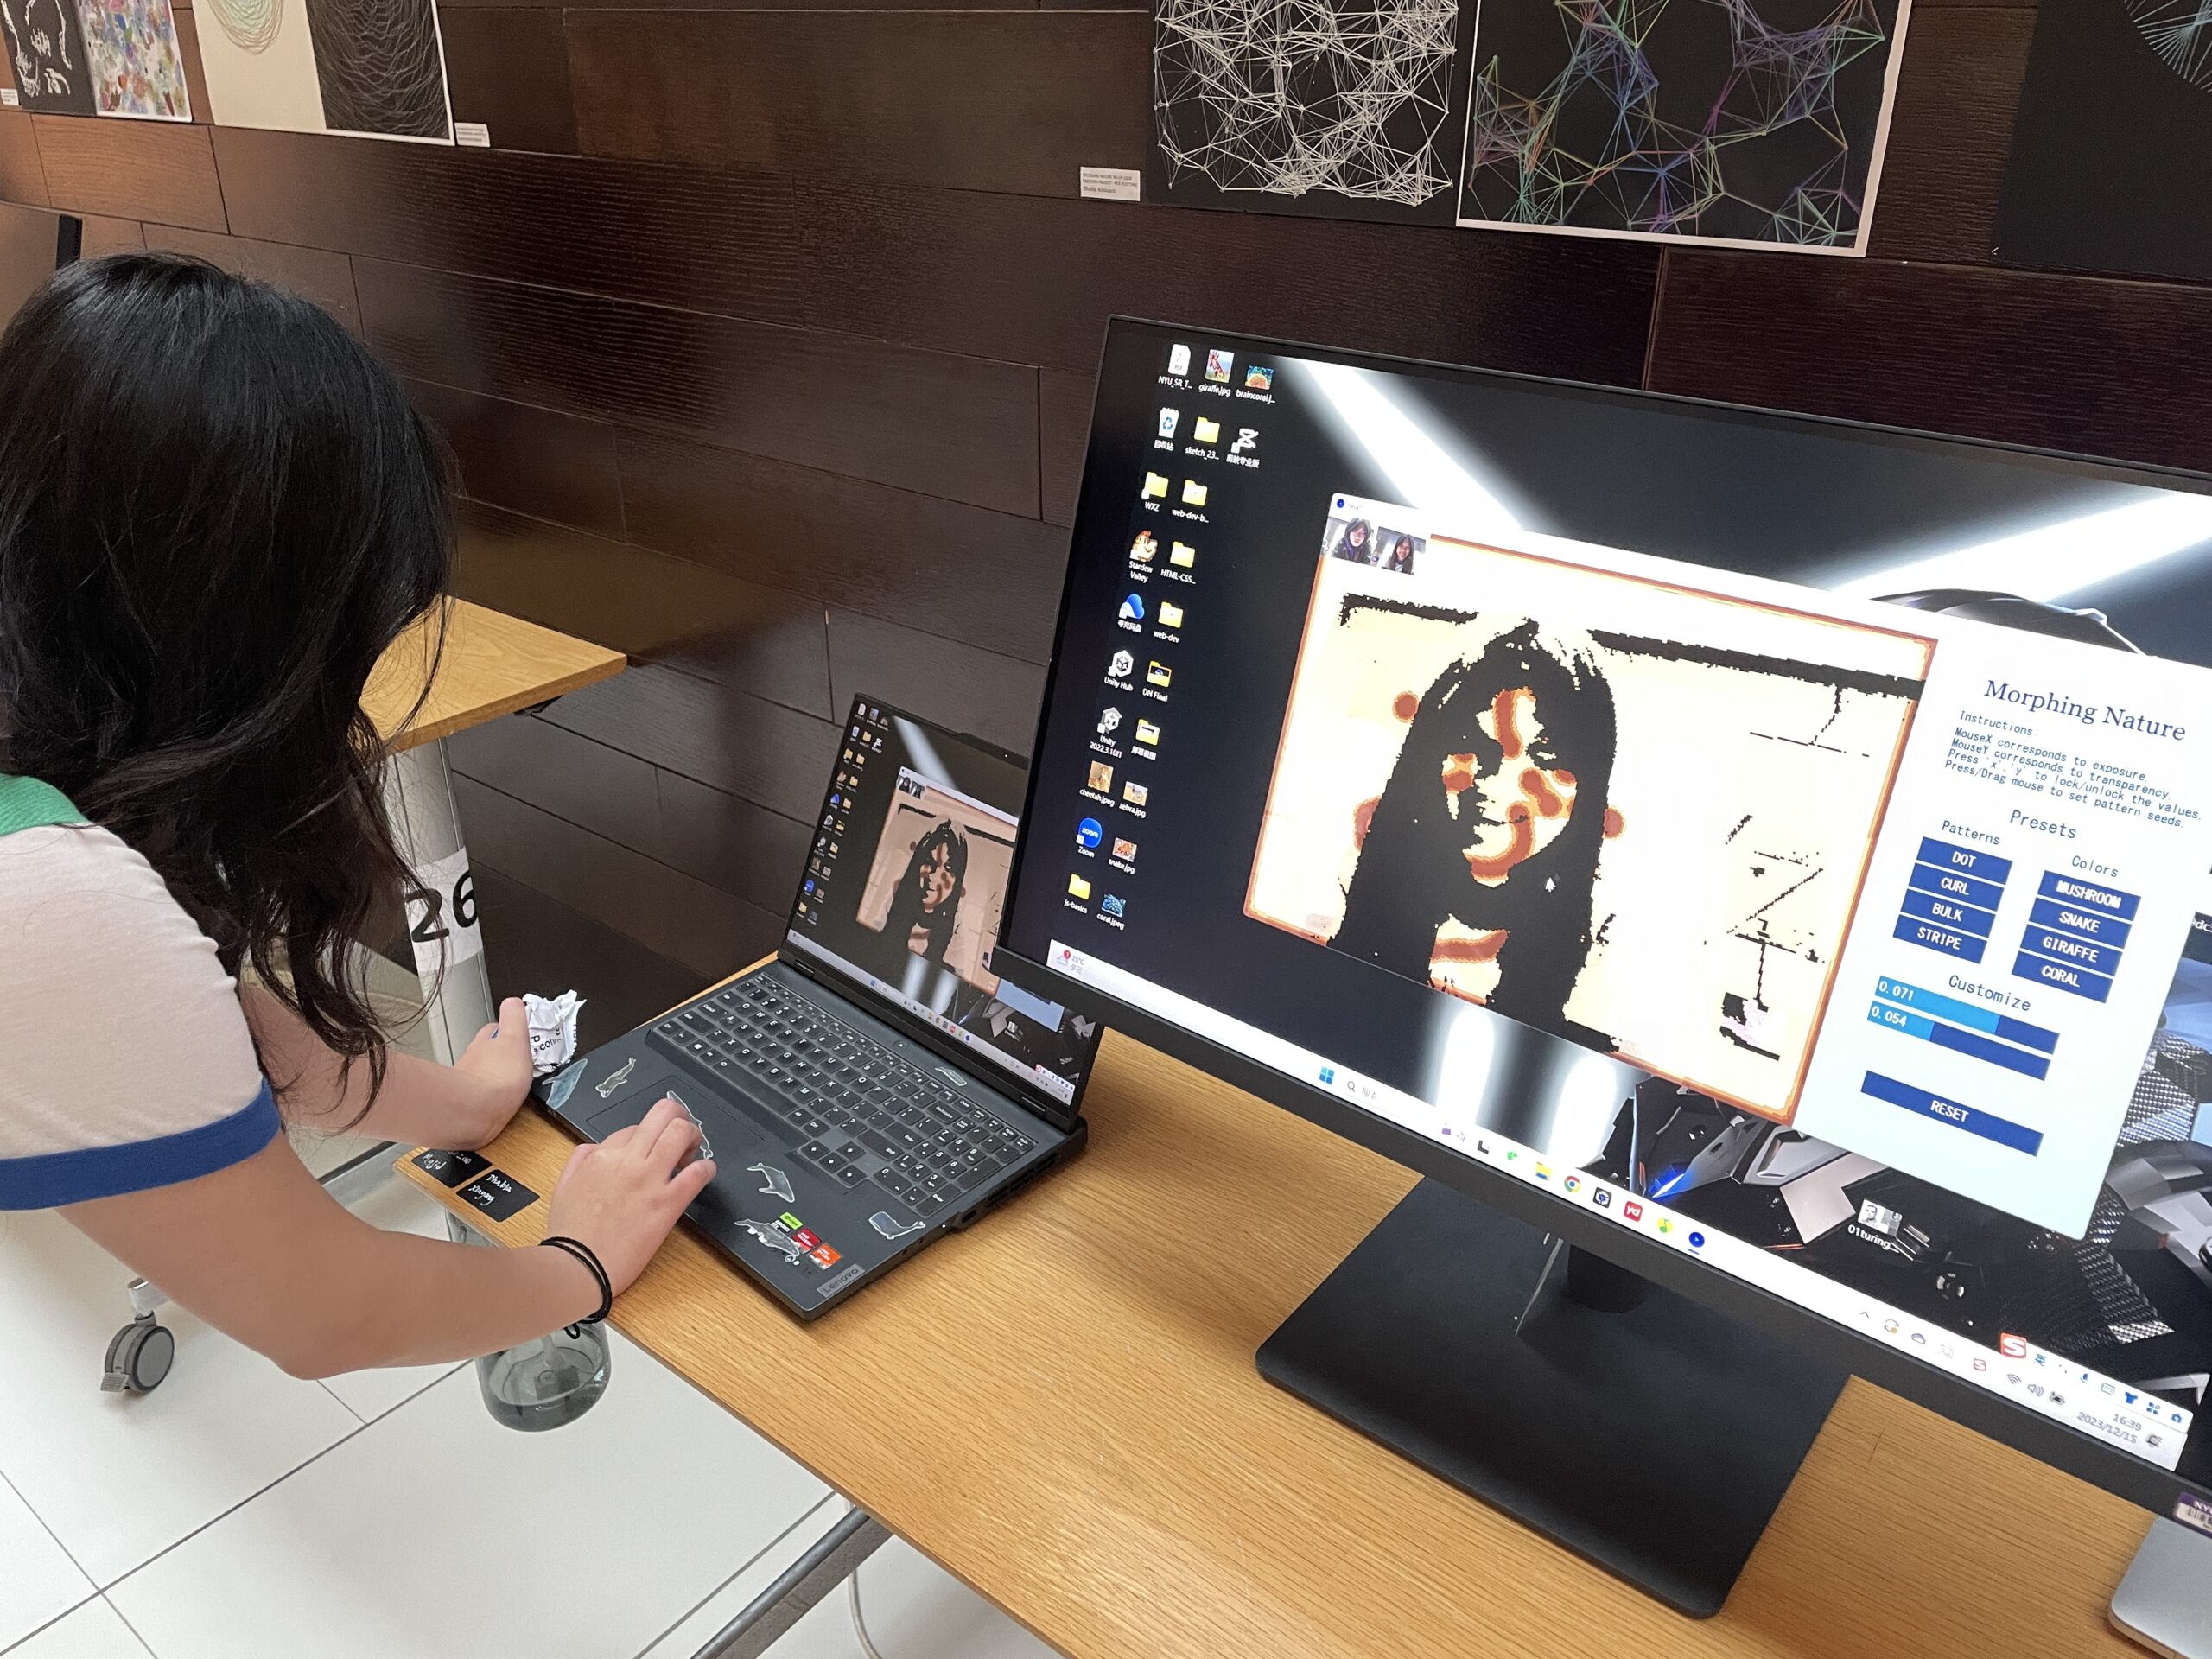
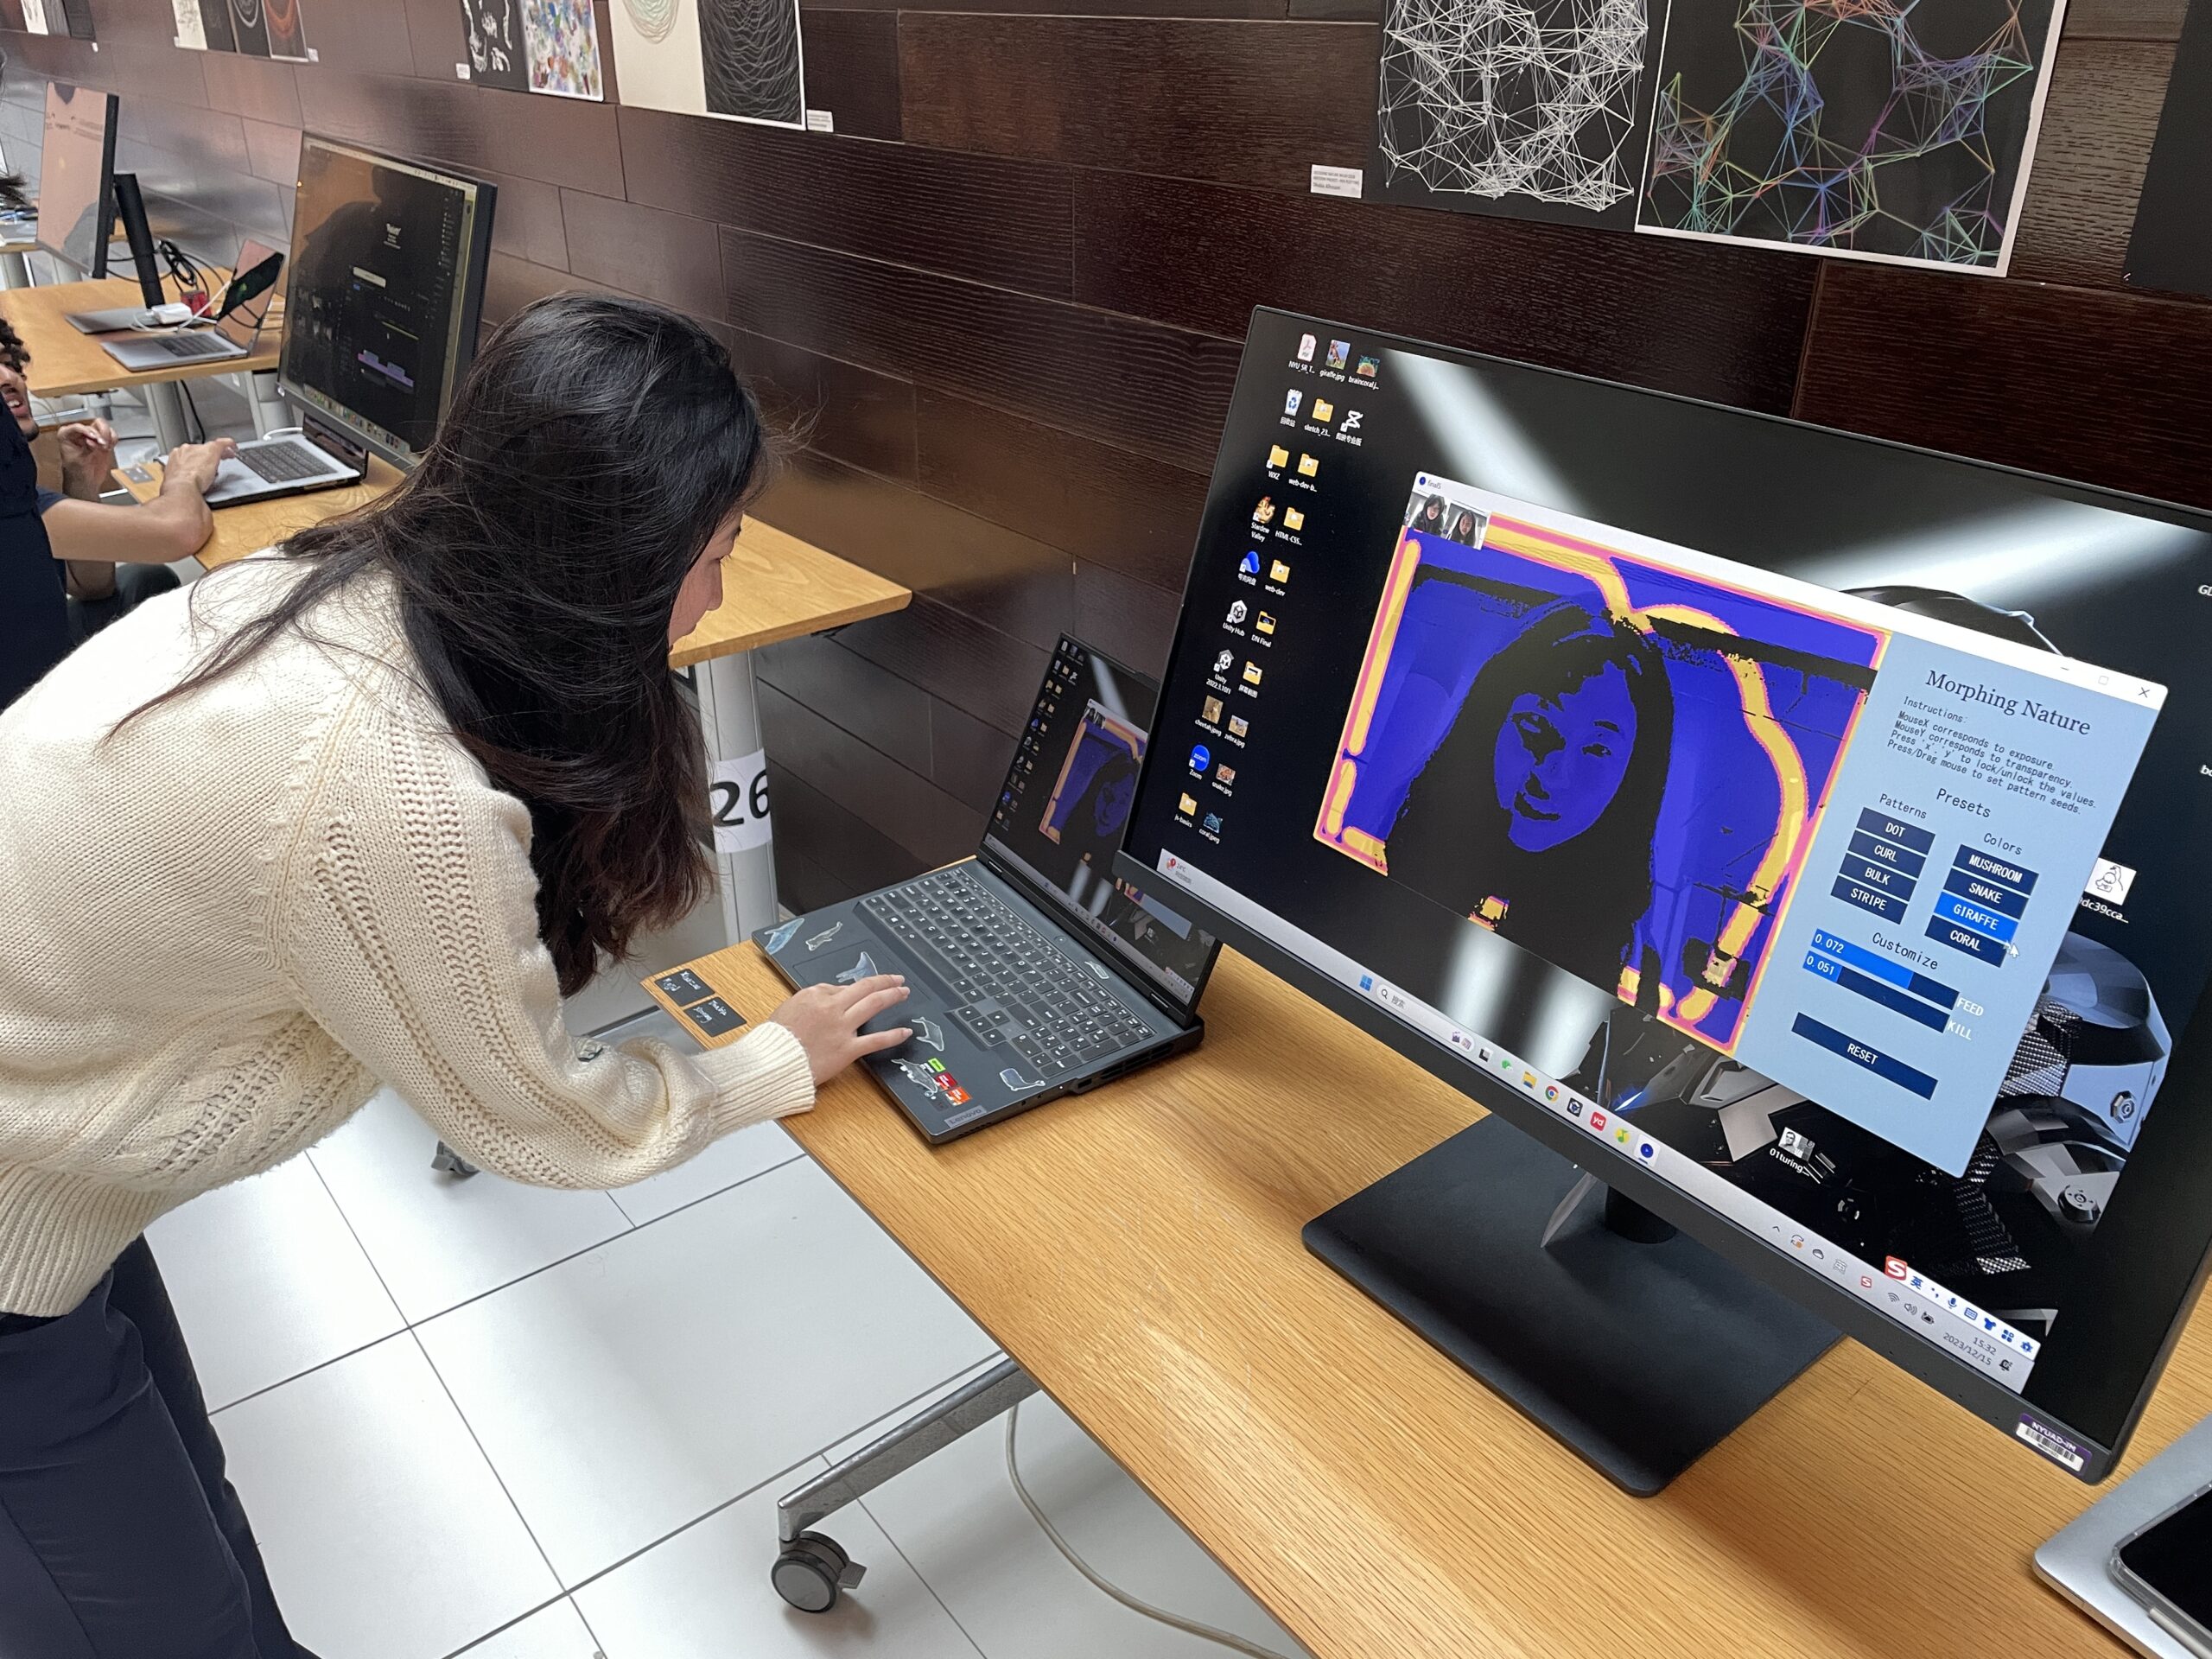
I added some customizable values to make the project more flexible to different lighting, skin colors, and preferences. As a user, you can move your mouse across the X-axis to change the exposure, and across the Y-axis to change the transparency of the mask.

At last, I added a GUI using the controlP5 library. The user will be able to use the preset patterns and color palettes as well as adjust the parameters on their own.

User testing on IM show:

C. Future Development

  1. I would like to add a color picker to the control panel and allow users to select the color on their own. It is doable with controlP5.
  2. To increase performance, the resolution is sacrificed. I wonder if building a more powerful and fast simulation engine is possible?
  3. I think it would be very interesting to map the patterns to a 3d character in game engines like Unity. As long as we have an understanding of how the equation works, it can be applied to many project forms!

Final Project – Wildfire

Concept:

In order to define fire suppression tactics and design fire risk management policies, it is important to simulate the propagation of wildfires. In my final project, I’ll be using cellular automata to model the spread of wind-driven fire across a grid-based terrain, demonstrating the dynamics of wildfires and exploring different scenarios and factors affecting their spread.

Users will be able to set the initial conditions (i.e. density of vegetation, vegetation type, ignition point), adjust parameters (i.e. wind speed, wind direction, temperature), monitor variables (i.e. frames per second, land proportion, water proportion, burned land), pause, and reset the simulation.

Final Sketch:

https://editor.p5js.org/bdr/full/2S_n0X2gV

Code:

https://editor.p5js.org/bdr/sketches/2S_n0X2gV

Initial sketches:

View post on imgur.com

View post on imgur.com

Papers to be used:

https://www.fs.usda.gov/rm/pubs_int/int_rp115.pdf

Code walkthrough:
Terrain generation:

The generateCells() function creates a terrain by dividing the map into cells to form a 2D grid (representing a cellular automata). Within each grid cell (defined by x and y coordinates), various noise functions are used to generate different aspects of the terrain.

generateCells() mainly defines the elevation of each cell in the grid through a combination of noise functions. Noise, Marks, Distortion, Bump, and Roughness are all variables employed with different scaling factors and combinations of input derived from the x and y coordinates. The noise functions were determined through trial and error.

roughness = noise(x / 600, y / 600) - 0.3;
bumpdistort = noise(x / 20, y / 20);
bumpnoise = noise(x / 50, y / 50, 2 * bumpdistort);
h = noise1 + sq(sq(noise2)) + roughness * bumpnoise - 0.8;

The color of each point is determined based on its height and other noise values, influencing factors such as land type (e.g., vegetation or ocean) and terrain features.

Using HSB as the color mode, the hue component represents the color’s tone (e.g., red, green, blue) while the brightness component corresponds to the perceived elevation. This makes it intuitive to represent different elevations using a gradient of colors (e.g., blue for lower elevations to white for higher ones), making the terrain visually more coherent and natural-looking.

if (h > 0) {
  clr = color(20 + 10 * (marks1 - 4) + 10 * (marks2 - 4) + 20 * distort1 + 50 * distort2 + bumpnoise * 15,
  min(100, max(50, 100 - 500 * roughness)), 75 + 65 * h);
  veg = getColor(clr)
  pointData = { x: x, y: y, color: clr, vegetation: veg, fire: 0, elev: elevationClr, temp:null};
  landCnt++;

} else {
  clr = color(160, 100, 185 + max(-45, h * 500) + 65 * h + 75 * (noise2 - 0.75));
  veg = getColor(clr)
  pointData = { x: x, y: y, color: clr, vegetation: veg, fire: 0, elev: elevationClr, temp:null};
  oceanCnt++;
}

The elevation/height is mapped as to the more the cell is in the middle of the ocean, the deeper it gets, and the more in the middle of the land, the higher it gets.

Initial step:

View post on imgur.com

Simplified sketch: As the sketch needed around 3 seconds to render, and cellular automata required a constant update of the sketch, simplifying the sketch was crucial. So, instead of calculating the noise for every pixel, I skip one by predicting its color.

View post on imgur.com

Vegetation:

Vegetation type propagation probability:
– No vegetation: -1
– Cultivated: -0.4
– Forests: 0.4
– Shrub: 0.4

Vegetation density propagation probability:
– No vegetation: -1
– Sparse: -0.3
– Normal: 0
– Dense: 0.3

Rules:

– R1: A cell that can’t be burned stays the same
– R2: A cell that is burning down at the present time will be completely burned in the next iteration.
– R3: A burned cell can’t be burned again.
– R4: If a cell is burned, and its neighbors contain vegetation fue, the fire can then propagate with a given probability (factors).

The fire propagation probabilities are:

View post on imgur.com

P0: ignition point (user interaction)
P_veg: vegetation type
P_den: vegetation density
Ps: topography
Pw: wind speed and direction

View post on imgur.com

with C1 and C2 are adjustable coefficients
V is the wind speed
O is the angle between the wind direction and the fire propagation (if aligned, Pw increases)

View post on imgur.com

with a: adjustable coefficient
o: the slope angle of the terrain

View post on imgur.com

with E: elevation of the cell
D: the size of the square cell if adjacent or sqrt(2*cellSize) if diagonal

Cellular Automata rules:

Implement rules governing the spread of fire: Fuel, topography, wind, and humidity.
– R1: A cell that can’t be burned stays the same
– R2: A cell that is burning down at the present time will be completely burned in the next iteration.
– R3: A burned cell can’t be burned again.
– R4: If a cell is burned, and its neighbors contain vegetation fue, the fire can then propagate with a given probability (factors).

function generateNextGeneration() {
    for (let i = 0; i < width; i+=2) {
        for (let j = 0; j < height; j+=2) {
            let neighbors = countNeighbors(i, j);
            let windAffectedProb = calculateWindEffect(i, j, windSpeed, windDirection);

            if (grid[i][j].fire==0 && neighbors==0){ // no fire, neighbors no fire
                nextGrid[i][j].fire=0;
            }
            if (grid[i][j].fire==0 && neighbors!=0 && grid[i][j].vegetation==0){ // water, neighbor fire, probability 0%
                nextGrid[i][j].fire=0;
            }
            probability = Math.floor(random(1,100));
            windInfluence = random(0, 100);
            if (grid[i][j].fire==0 && neighbors!=0 && grid[i][j].vegetation==1 && probability<10 && windInfluence < windAffectedProb && temperature>0){ // sparse, neighbor fire, probability 10%
                nextGrid[i][j].fire=1;
                nextGrid[i][j].color=color(14, 252, 113);
            }
            probability = Math.floor(random(1,100));
            windInfluence = random(0, 100);
            if (grid[i][j].fire==0 && neighbors!=0 && grid[i][j].vegetation==2 && probability<50 && windInfluence < windAffectedProb && temperature>0){ // no fire, neighbor fire, normal veg, probability 70%
                nextGrid[i][j].fire=1;
                nextGrid[i][j].color=color(14, 252, 113);
            }
            probability = Math.floor(random(1,100));
            windInfluence = random(0, 100);
            if (grid[i][j].fire==0 && neighbors!=0 && grid[i][j].vegetation==3 && probability<30 && windInfluence < windAffectedProb && temperature>0){ // no fire, neighbor fire, dense veg, probability 100%
                nextGrid[i][j].fire=1;
                nextGrid[i][j].color=color(14, 252, 113);
            }
            else if (grid[i][j].fire==1){ // burning
                nextGrid[i][j].fire==-1;
                nextGrid[i][j].color=color(0, 0, 57);
                burnedCnt++;
                burnedBlocks[`${i}_${j}`] = true;
            }
            else if (grid[i][j].fire==-1){ // burned
                nextGrid[i][j].fire==-1;
                nextGrid[i][j].color=color(0, 0, 57);
            }
        }
    }
    swapGenerations();
}
Other Maps:

Elevation Map: Users are able to visualize the elevation of the terrain by using the button at the right of the screen.

View post on imgur.com


Elevation type: Users are also able to visualize the tyoe of vegetation (forests, shrubs, cultivated…)

View post on imgur.com

Wind: Users are also able to see the wind direction and modify it using the slider.

View post on imgur.com

Challenges:

Improving the computation time was a rather challenging time. After optimizing it, it went from 3s to 0.35s.

IM Show Pictures:

View post on imgur.com

View post on imgur.com


Shreya’s Wilderness Forest – Final Project

THE FINAL SKETCH

Click on the button to enter the simulation!

Here is the full p5.js code: https://editor.p5js.org/shreyagoel81601/sketches/Y6gK7f1Iz

MY DESIGN GALLERY

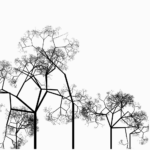
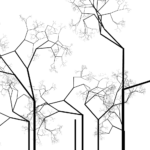
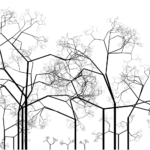
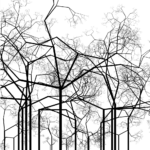
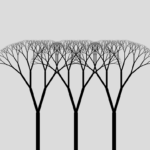
Below are the various different outputs I got from my above sketch:

INSPIRATION, CONCEPT & ARTISTIC VISION

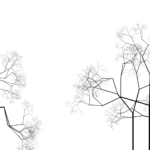
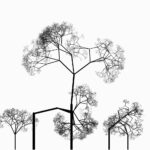
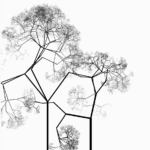
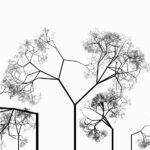
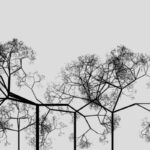
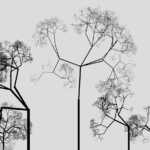
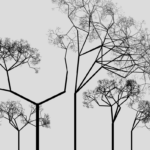
We studied fractals in class and I was specially fascinated by it. Just a recursive function with some property to it, a set of rules, and one can make such interesting patterns! I wanted to delve deeper and explore the field of fractals further for my final project, using it in a creative way to design intricate and mesmerising patterns that one wants to keep looking at.

Fractals are an important branch in mathematics and its recursive properties (i.e. self-similarity) are of interest in many fields. They are used in applied mathematics for modelling a variety of phenomena from physical objects to the behavior of the stock market. The concept of the fractal has also given rise to a new system of geometry crucial in physical chemistry, physiology, and fluid mechanics. But what if fractals were not limited to these set of equations and properties jargon to many but presented in a visually appealing way to the wider audience? To really show how broad and fascinating the field of math is and how it can be used to create art. That is what I set out my final project to be. To really curate a design or simulation which evolves over a period of time just based of fractal properties we study in math. More about fractals: source1, source2, source3.

Mathematical fractals:

Fractals in nature:

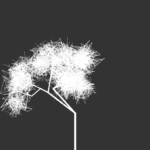
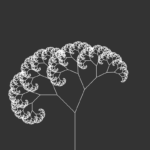
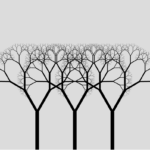
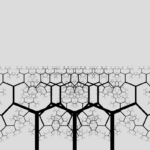
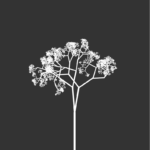
Out of all the fractals that exist out there, I was most intrigued by the ones that appear in leaves and trees and hence decided to re-create those using the idea of recursion with some of the known fractal equations and set of rules. However, the focus was not only on generating naturally occurring fractal patterns – the trees, but also putting them together in a creative way, artistically curating it into some sort of a generative algorithm or simulation, evolving over period of time with which the users could interact and play with. I proceeded with simulating a forest scenario – where users can plant a tree, make them fall, or have them sway upon their hover interaction, as if one is shaking their trunk!

THE PROCESS, TECHNICAL DESIGN & IMPLEMENTATION

I started with first reading thoroughly upon fractals and informing myself about those so I could choose which kind of fractals to go with, how to code them, what properties to use, etc. I had known what fractals are, but now, I was interested in knowing their origin, their nature, how it gives rise to certain forms and patterns, and so on. I went down a rabbit hole studying fractals, to the extent that I started proving its properties xD. It was very enriching!

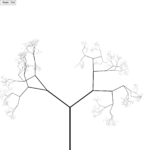
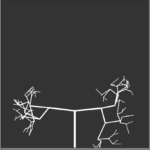
My project uses 2 kinds of fractals – the L-system (for the instructions/home page), and stochastic branching fractals for the main wilderness forest part. I started with what we had in class first, the recursive way of building the stochastic trees and played with its design to create a forest like system. See below my initial sketch:

// in setup()
  fractalTree(width/4, height, length*1.2, 8);
  fractalTree(width/8, height, length*0.5, 3);
  fractalTree(width/2, height, length*1.5, 7);
  fractalTree(width/8*7, height, length*0.5, 3);
  fractalTree(width/4*3, height, length*0.7, 5);

// the recursive function
function fractalTree(x, y, len, weight) {
  push();
  if (len >= 2) {
    //draw the first line
    strokeWeight(weight);
    translate(x, y);
    line(0, 0, 0, -len);  
    translate(0, -len);
    weight *= sweight;
    strokeWeight(weight);
    weight *= sweight;
    
    let num = int(random(4));
    for(let i = 0; i <= num; i++) {
      push();
      let theta = random(-PI/2, PI/2);
      rotate(theta);
      fractalTree(0, 0, len*0.67, weight);
      pop();
    }
  }
  pop();
}

Above is a static version, it has no movement or user interaction yet. Next I tried exploring L-systems. Here is the sketch for that:

// in setup()   
  let ruleset = {
    F: "F[F]-F+F[--F]+F-F",
  };
  lsystem = new LSystem("F-F-F-F", ruleset);
  turtle = new Turtle(4, 0.3);

  for (let i = 0; i < 4; i++) {
    lsystem.generate();
  }

// in draw()
  translate(width / 2, height);
  
  let angle = map(mouseX, 0, width, -0.3, 0.3);
  let h = map(mouseY, height, 0, 0, 8);
  turtle = new Turtle(h, angle);
  
  turtle.render(lsystem.sentence);

After playing around and educating myself of the different ways one can use fractals to simulate trees and forest situations, it was time to curate the performance. I wanted to have the trees not be static, but grow slowly, and also sway as if wind is blowing. For this, it was necessary that I move away from the recursive way of coding because a recursive function just draws the tree once, done, it stores no property taht one can alter to later on play with it and achieve the results I intended to create. Hence, I transitioned to an OOP way inspired by Coding Train.

class Branch {

  constructor(begin, end, strokew) {
    this.begin = begin;
    this.end = end;
    this.finished = false;
    this.strokew = strokew;
    this.speed = random(4,12);
  }

  branchA() {
    let dir = p5.Vector.sub(this.end, this.begin);
    dir.rotate(random(-PI/2, PI/2));
    // dir.rotate(PI / 6 + dtheta);
    dir.mult(0.67);
    let newEnd = p5.Vector.add(this.end, dir);
    let b = new Branch(this.end, newEnd, this.strokew*0.8*0.8);
    return b;
  }

  branchB() {
    let dir = p5.Vector.sub(this.end, this.begin);
    dir.rotate(random(-PI/2, PI/2));
    dir.mult(0.67);
    let newEnd = p5.Vector.add(this.end, dir);
    let b = new Branch(this.end, newEnd, this.strokew*0.8*0.8);
    return b;
  }
}
let forest = [];
let numTrees = -1;

genButton = createButton("Grow");  
genButton.mousePressed(createNewTree);

function createNewTree() {
  let len = randomGaussian(height*0.25, 20);
  let x = random(10, width-10);
  let w = map(len, 0, height/2, 2, 12);
  
  let a = createVector(x, height);
  let b = createVector(x, height - len);
  let root = new Branch(a, b, w);

  let tree = []
  tree[0] = root;
  forest.push(tree);
  
  numTrees++;
  count = 0;

  generateBool = true;
}

function generate() {
  let tree = forest[numTrees];

  if (count < 12) {
    for (let i = tree.length - 1; i >= 0; i--) {
      if (!tree[i].finished) {
        tree.push(tree[i].branchA());
        tree.push(tree[i].branchB());
      }
      tree[i].finished = true;
    }
    count++;
  }
  else {
    generateBool = false;
  }
}

function draw() {
  if (generateBool) {
    generate();
  }
}

However, this was not easy or straightforward. I ran into many challenges.

BLOOPERS

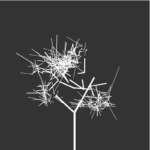
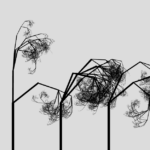
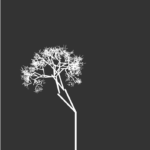
To implement the sway feature, I decided to have the trees jitter upon mouse hover, to create the effect of a user shaking the tree. The basic idea for this was to change the angle of each branch for it to create a sway effect, but that lead to disintegrating the tree (see below).

This happens because when creating the tree, each branch starts from the end of previous branch, and when I rotate, the end point of previous branch moves but not the starting point of the new branch. The way I fixed this is by altering the end points for sway and not the angle and then redrawing the next branches based on this new end point.
if (mouseX < width && mouseX > 0 && mouseY < height && mouseY > 25) {
      for (let j = 0; j < forest.length; j++) {
        let tree = forest[j];
        if (abs(mouseX - tree[0].begin.x) < range){
          for (let i = 1; i < tree.length; i++) {
            tree[i].jitter();
          }
        }
      }
    }

Another issue I faced was nailing how many branches the tree should have. Because otherwise it was getting too heavy for the program to run and my laptop kept on crashing. If it was too little branches, then it would not look like a tree, or real, and would defeat the purpose of the whole model.

INSTRUCTIONS PAGE

THE PROCESS PHOTOS

IM SHOWCASE PRESENTATION

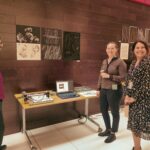
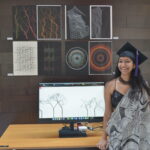
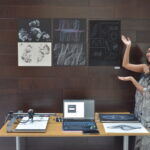
My project was exhibited at the Interactive Media End of Semester Showcase at New York University Abu Dhabi where it was interacted with by many people, not just students, but faculty, staff, dean from all majors.

Final Project: Vector Body Motion Visualizer

Inspiration:

I have always been interested by programs that can locate certain areas of the body or face through advanced technology. Although it is a very critical process and it takes several trials and sample pictures to achieve, its results in a very exciting and rather interactive process.

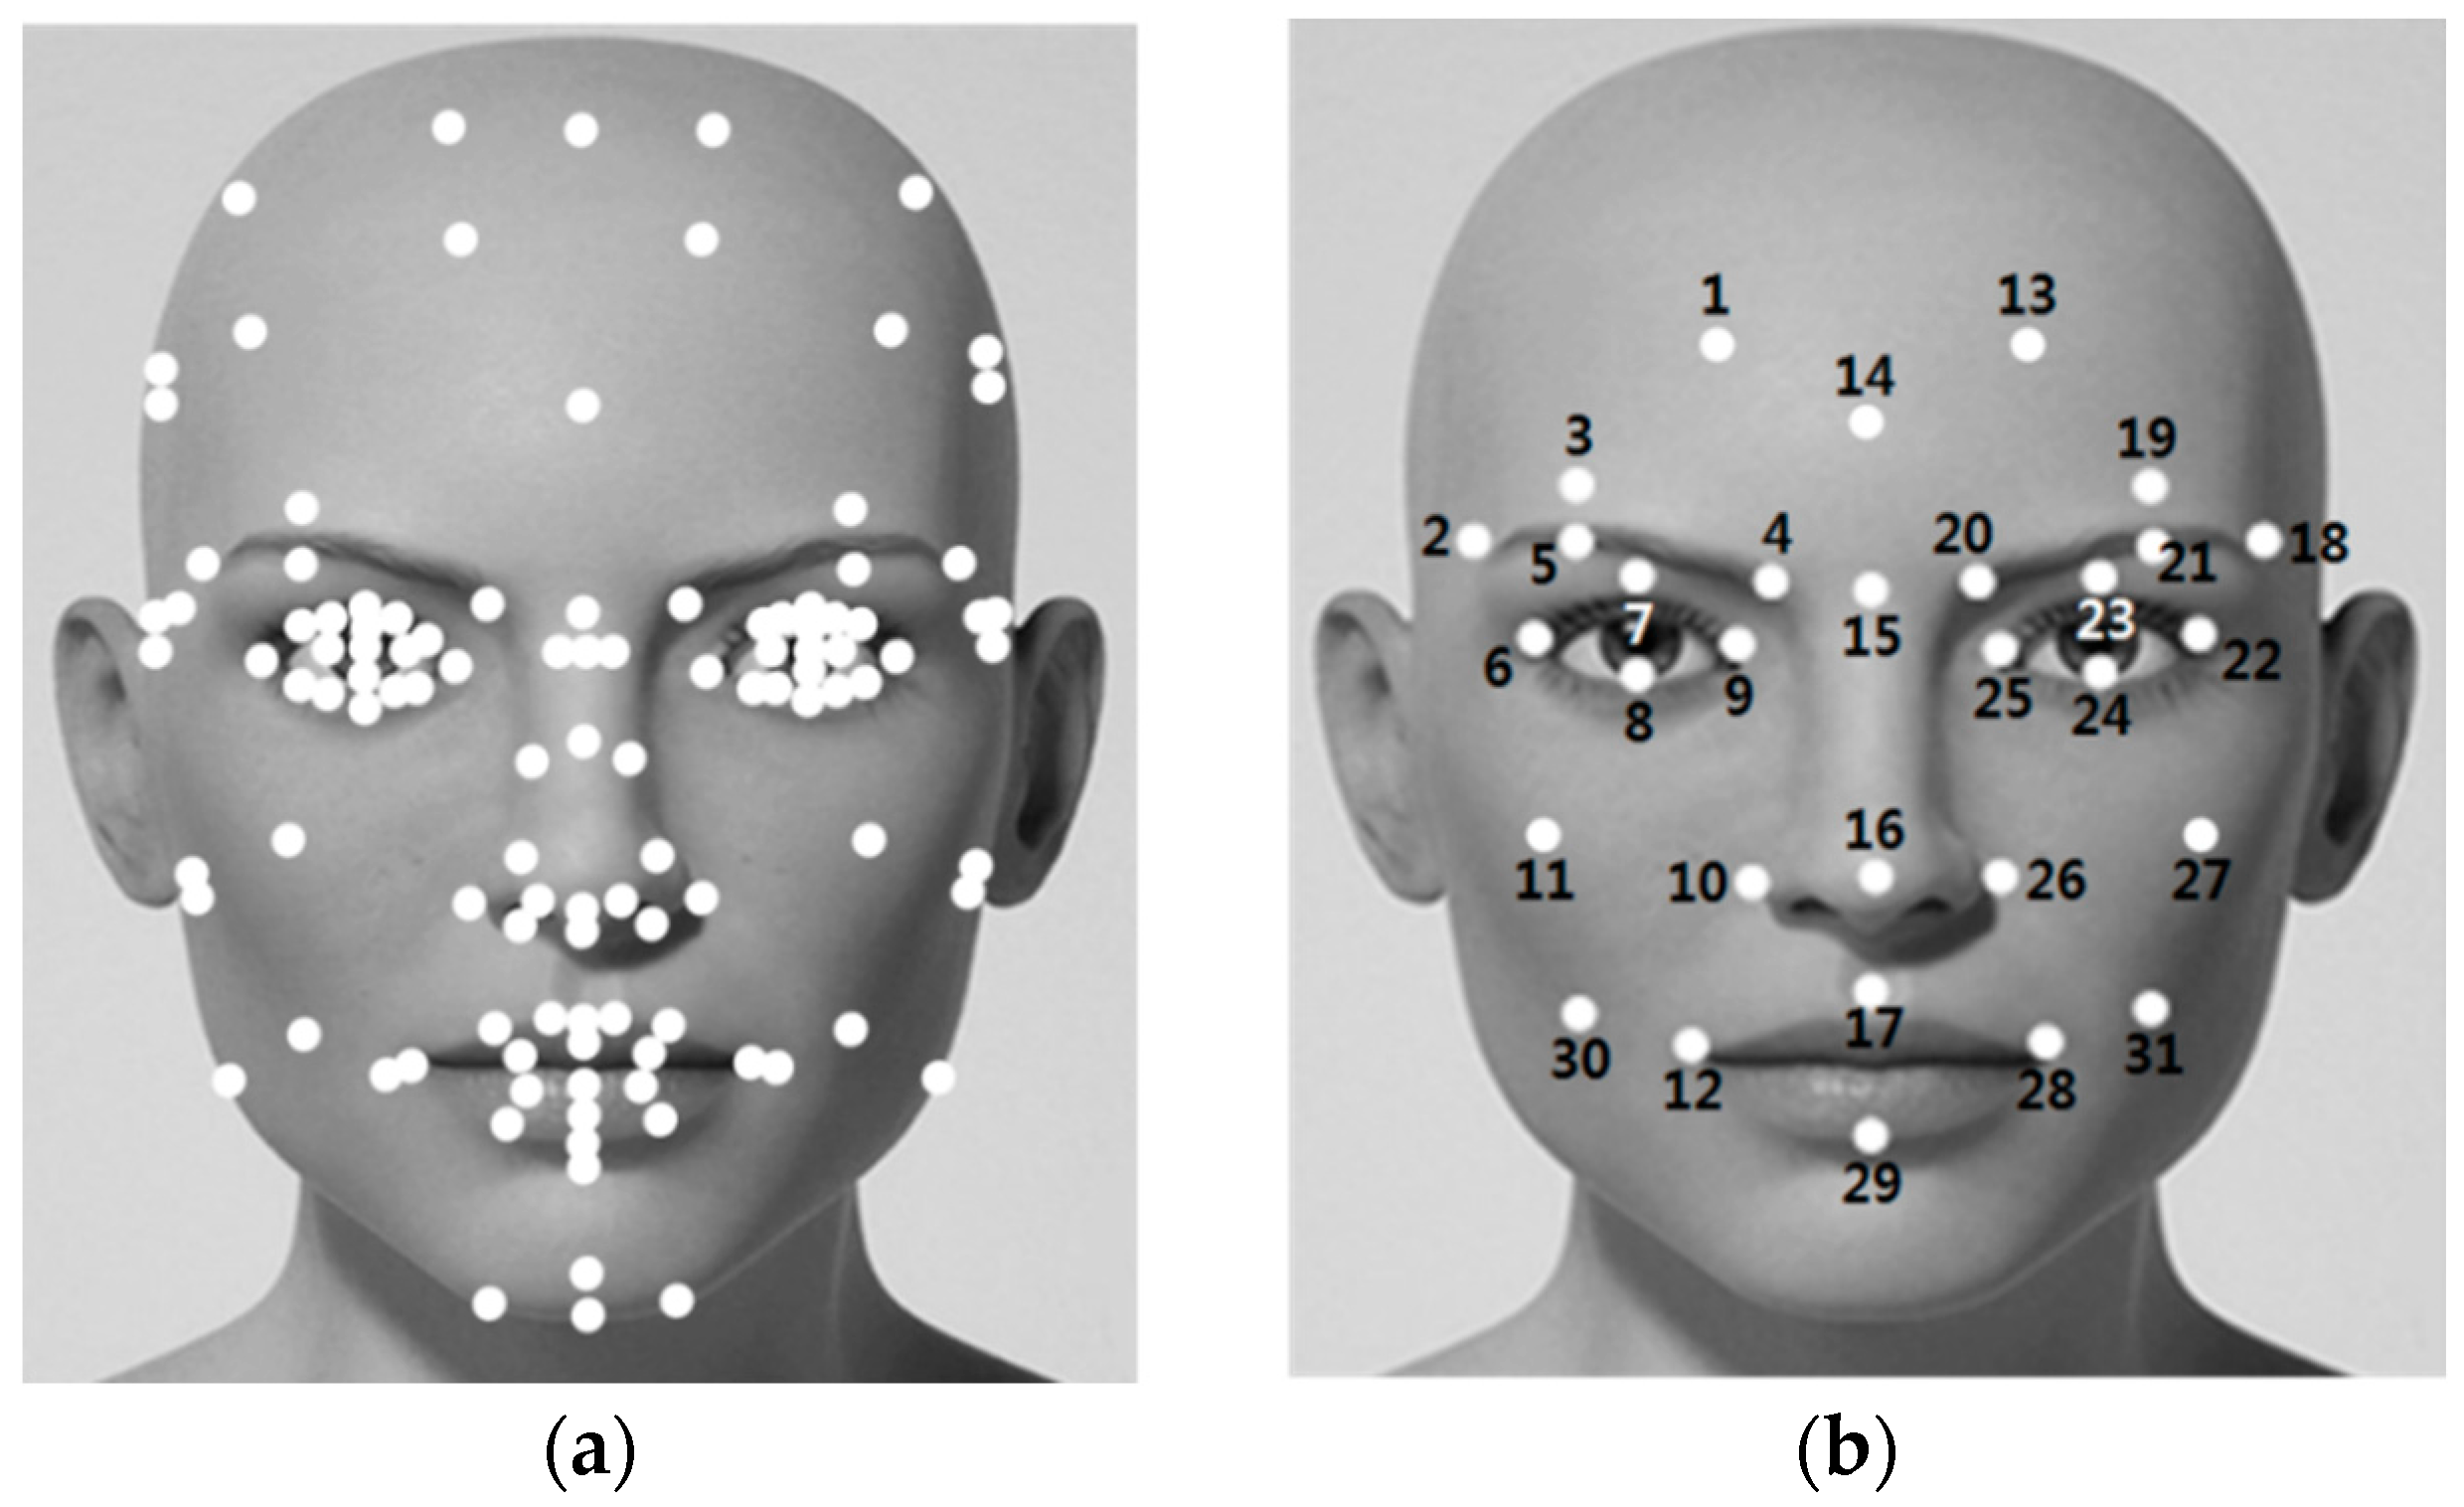
Symmetry | Free Full-Text | Facial Feature Movements Caused by Various Emotions: Differences According to Sex

Although this concept is really interesting, what fascinated me even more is just how much we can do with these facial marker. What I found interesting was the ability to track vectors to mimic the facial movements, and to draw those vectors and represent over the camera. As I thought of these changes in the displacement and the x and y values of the vector I wondered how we can visualize this change, and that is when I thought of a simple graph used in physics and maths all the time, a Position vs. Time Graph!

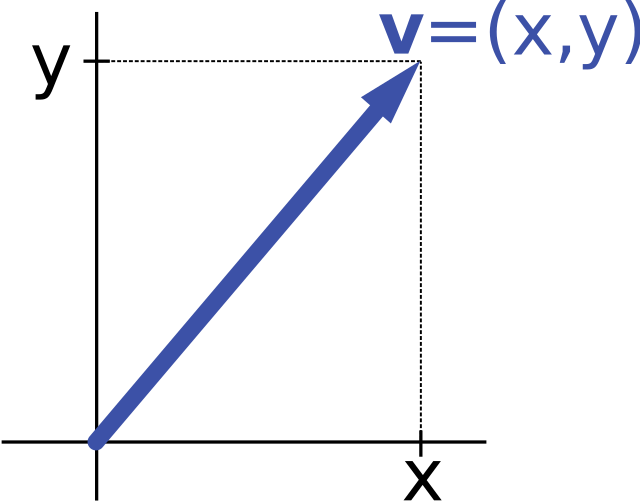
2.3 Position vs. Time Graphs | Texas GatewayVector notation - Wikipedia

Concept:

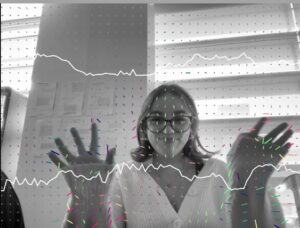
My program aims to use the p5.js library to capture video input, analyze optical flow, and visualize motion through graphical representations with the help of vectors. Mainly visualizing vertical and horizontal changes in the vectors. The flow file deals with detecting motion and optical flow, which are concepts beyond the scope of the class, but with the help of implementations I found online I integrated them in the flow.js file

The flow and its arguments returned are then used to draw motion vectors on the canvas, representing vertical and horizontal motion detected. In addition, the program instantiates two instances of the graph class to visualize the left-right (graph on top) and up-down (graph on the bottom) motion over time, creating trailing graphs that represent the history of the patterns. Throughout the draw loop, the motion vectors are modified with Perlin noise to introduce randomness and trigonometry as well.

How it Started:

Initially I had a completely different idea in mind. I planned to take several of these quick sketches i implemented and have a program represent how words and actions can make a difference, and my initial sketches are shown bellow:


When looking at the pros and the cons of integrating all these sketches into one, I found that the cons were outweighing the pros. The positives of this idea is that it uses many concepts of the ideas we covered in class, from vectors, fractals, steering forces, perlin noise, particle system, and more.

However the biggest downside of this idea was although it ticked the boxes of integrating the material taught in class, it lacked visual aesthetics. Not only that, but p5.js usually lags and slows down when integrating too many things at once, especially if it includes user interactions.

Initially I took inspiration from the flow field code demonstration we had gone over in class that integrated perlin noise. I then integrated the webcam as my user interaction method. While working with displaying the vectors I went back to the perlin noise integration and decided to add that to the vectors to ensure a smoother transition when the vectors x and y components are changing.

Final Project: Stages

Stage 1: Camera Input 

https://editor.p5js.org/ea2749/full/W9QWMntNK

Stage 2: Integrating flow field and Perlin Noise

https://editor.p5js.org/ea2749/full/aTHHs17Mj

Stage3: RGB dependencies on vector’s x and y

https://editor.p5js.org/ea2749/full/hrdedXJrD

Stage 4: Graphical Representation& Final Tocuches

https://editor.p5js.org/ea2749/full/2-pGvXr8o

Tackling Challenges:

The main challenge I faced was trying to understand the user interaction methods I wanted to use. Since I wanted to explore outside my comfort zone, I had to try new types of user interactions besides the mouse and keyboard, so I decided I wanted to use the webcam

Face marker locations (blue dots) in the Vicon recordings. The markers... | Download Scientific DiagramMarker MPEG-FAP association with the TRACK's reference model. The MPEG... | Download Scientific Diagram

While using the camera, I found ways online in which we can get these facial points, however, translating the returned values of these methods and programs that help us navigate such interactions into arguments I can use similar to our vector implementation in class was difficult. When dealing with user interaction methods like these, we don’t always get values or return types that are flexible to use with any method or class, so modifying, simplifying the code, using chat GPT,  and trials and errors helped.
Snippets of Code:

Displaying Vectors and Using them as Arguments:

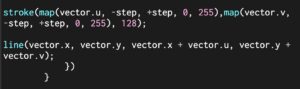
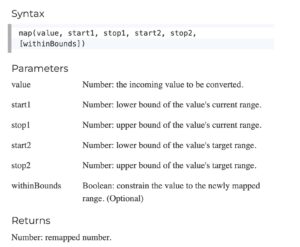
Vectors were represented by lines, taking the x and y values of the vector as arguments for the line. As for the color, we use the map function to take a value from the horizontal/verticle component of the vector and translate it to a value from 0 to 255 so we can use them as our RGB values. Notice how the colors will only change if the vectors horizontal/verticle component changes, meaning the colors change only when movement is detected.

Using Perlin Noise:

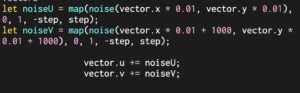
Using perlin noise to achieve a smoother transition between the movement of the vectors and also using the map function to translate the values into smaller values that will make the noise function more seamless and smooth.

Using Trigonometry:

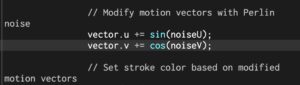
Using trigonometry specifically sin and cosine to limit the incrementing of the vertical and horizontal component of the vector from [-1,1]. This limits our incrementing even more making the transitions even more smooth and seamless.

FINAL Product:

https://editor.p5js.org/ea2749/full/2-pGvXr8o

Reflection and Areas of Improvement:

To conclude this project, and this semester, I really enjoyed the process of developing this project mostly because I got to learn so many concepts of user interaction, and I also was able to integrate concepts taught in class such as vectors, perlin noise, and trigonometry.

Core Principles: Critical Reflection - Center for the Professional Education of Teachers

To further advance this project, I plan to find other ways to make this project more interactive, perhaps creating more sensitivity to motion. Or perhaps having the vectors react differently based on the extent of motion. I also think the project could have been better if I used objects from the physics libraries instead of representing the vectors as lines.

The IM ShowCase:

Final Project – Pacman’s EcoSim

Inspiration:

The inspiration for this project was the concept of an ecosystem simulation. The idea was to create a dynamic environment where different entities interact with each other and evolve. The entities in this ecosystem are Boids, Pacmen, and Ghosts, each with their own behaviors and attributes. The user can be the decider of how these creatures evolve by adjusting these attributes using sliders.

Why Pacman?

The Pacman theme was chosen for this project due to its familiarity, aesthetics, and game dynamics. It’s a well-known game, making the ecosystem simulation easy to understand. The bright colors and simple shapes enhance the user experience, and the game’s chase and evade mechanics effectively illustrate predator-prey relationships in nature.

First Iteration:


The first iteration of the project involved setting up the basic structure of the ecosystem. These vehicles exhibit behaviors similar to those of living organisms, such as seeking food, avoiding poison, and reproducing. The main idea is to create a basic system that I can build on top of for my next iteration. I set up the foundational functions, such as seeking and reproduction.

Next Steps:

Fleeing Behavior: Fleeing behavior for the boids was added, which is triggered when a predator or apex predator is nearby. This made the simulation more realistic and dynamic.

Introduction of Apex Predators: Apex predators were introduced into the ecosystem. These entities hunt both boids and predators, adding another layer of complexity to the simulation.

User Controls Added: More user controls were added to the simulation. This included sliders to adjust the speed, reproduction rate, and lifespan of each entity type. This allows users to experiment with different settings and observe how they affect the ecosystem.

Pacman Theme: The visuals of the simulation were improved by using images instead of simple shapes for the entities. This made the simulation more visually appealing and engaging.

Performance Optimized: As the complexity of the simulation increased, the code was optimized to ensure that it ran smoothly. This involved techniques such as quadtree optimization for collision detection

Code that I am proud of:

seek(target) {
  let desired = p5.Vector.sub(target, this.position);
  desired.setMag(this.maxSpeed);
  let steer = p5.Vector.sub(desired, this.velocity);
  steer.limit(this.maxForce);
  this.applyForce(steer);
}

The seek() function in the ApexPredator class is used to move the apex predator towards a target. It calculates a desired velocity vector pointing from the apex predator to the target, sets its magnitude to the maximum speed of the apex predator, and then calculates a steering force to apply to the apex predator to move it towards the target.

flee(target) {
  let desired = p5.Vector.sub(this.position, target);
  desired.setMag(this.maxSpeed);
  let steer = p5.Vector.sub(desired, this.velocity);
  steer.limit(this.maxForce);
  this.applyForce(steer);
}

The flee() function in the Boid class is used to move the boid away from a target. It calculates a desired velocity vector pointing from the target to the boid, sets its magnitude to the maximum speed of the boid, and then calculates a steering force to apply to the boid to move it away from the target.

function changePlaySpeed(){
  if (playSpeed === 1) {
    playSpeed = 2;
  } else if (playSpeed === 2) {
    playSpeed = 4;
  } else if (playSpeed === 4) {
    playSpeed = 8;
  } else if (playSpeed === 8) {
    playSpeed = 1;
  }
  playSpeedButton.html('Play Speed:' + playSpeed + 'x');
}

The changePlaySpeed() function is used to cycle through different play speeds each time it is called. The play speed is displayed on a button in the user interface.

Challenges:

Autonomous Agent Logic

Implementing autonomous agent logic was a significant challenge. This involved creating behaviors for the boids, pacmen, and ghosts in the ecosystem. Each entity needed to have its own set of behaviors and interactions with other entities, which required a deep understanding of vectors, forces, and steering behaviors.

Slider Range Balancing

Balancing the range of the sliders was another challenge. The sliders control various attributes of the entities, such as speed, force, and reproduction rate. Finding a range that provided meaningful changes without causing extreme behaviors was a delicate balancing act.

Performance Management

Managing performance was a critical challenge. With potentially hundreds of entities on the screen at once, each with its own set of behaviors and interactions, the simulation could easily become slow and unresponsive. Optimizing the code to handle this complexity while still running smoothly was a significant part of the project.

Final Touches:

The final steps of the project involved refining the behaviors of the entities and improving the user interface. This included adding a button for generating the next generation of entities, and creating a screen for displaying the sliders that control the attributes of the entities.

Final Sketch:

Possible Future Improvements:

– Adding more entity types: The ecosystem could be made even more complex and interesting by adding more types of entities, such as plants or other types of animals.
– Implementing genetic algorithms: The entities could be made to evolve over time using genetic algorithms, with the most successful entities passing on their traits to the next generation.

-Special Creature Abilities: A possible improvement could be adding new abilities that the creatures can occasionally use to grow their numbers and recover from the brink of extinction.

IM Showcase:

The IM showcase was a success, and many people were stopping by to check out the class’s projects. The learning curve on the simulation was quite high for visitors and it took a while for them to get the hang of the game.

I also decided to showcase my midterm project, which actually caught the eyes of more people because it was more visually interesting.

Final Thoughts:

The journey of this project, from its initial conception to its final iteration, has been a testament to the iterative nature of design. It presented several challenges, but also provided the opportunity to learn and apply new concepts. The end result is a dynamic ecosystem simulation that is visually interesting to interact with. I still think however there is a lot more room for improvements in the future which I would like to explore.

You, I, everyone is a Black Hole

Black Holes are fun. The fact that they are so dense that even light can’t escape from their gravitational pull is itself intriguing. In this project, I present you a chance to become a black hole, at least an imaginary one.

Ambition

  1. I started with an unrefined generative art idea and experimented with a few things that went terribly wrong and couldn’t scale on a giant screen.
  2. For me, the most important part of this project was collaborative interaction that I wanted to achieve. And trust me on this, it’s not that simple as I imagined it would be.

I started with an idea of combining screens to generate an art piece. Based on the movement of the screen, the art would change and scale.

But this posed a lot of issues.

  1. First, not all screens are of same width and height.
  2. Resolution difference of each device also affects the generated browser viewport.
  3. Finding exact position is not impossible but is hard to achieve given the timeframe of this project.

With numerous failed attempts to perfect device positioning and motion, I realized I can still use device movements for the project to be interactive. Why? While mouse and keyboard are fun, there are only one each for one machine. How would multiple users participate?

This led to the idea of using devices to detect movement and affecting the generated art.

Pivot

I wanted to use Cellular Automata, Flocking, or Fractals but the idea of movement was quite difficult to visualize (at least I wasn’t able to).

But hey! We have Autonomous Agents!

Based on what we had studied in class about autonomous agents and their behavior, I came up with the black hole idea. Why not give everyone an opportunity to control a black hole and attract things towards it? And with the trail paths, we generate a vibrant collaborative art piece.

Falling into a Black Hole

The concept of Arrival in autonomous agents is quite similar to how things fall into a black hole. When objects are near to the event horizon, time beyond the black hole moves fast for the objects falling in, but for an observer observing the falling object, it appears to fall quite slow.

Einstein’s theory of General Relativity!

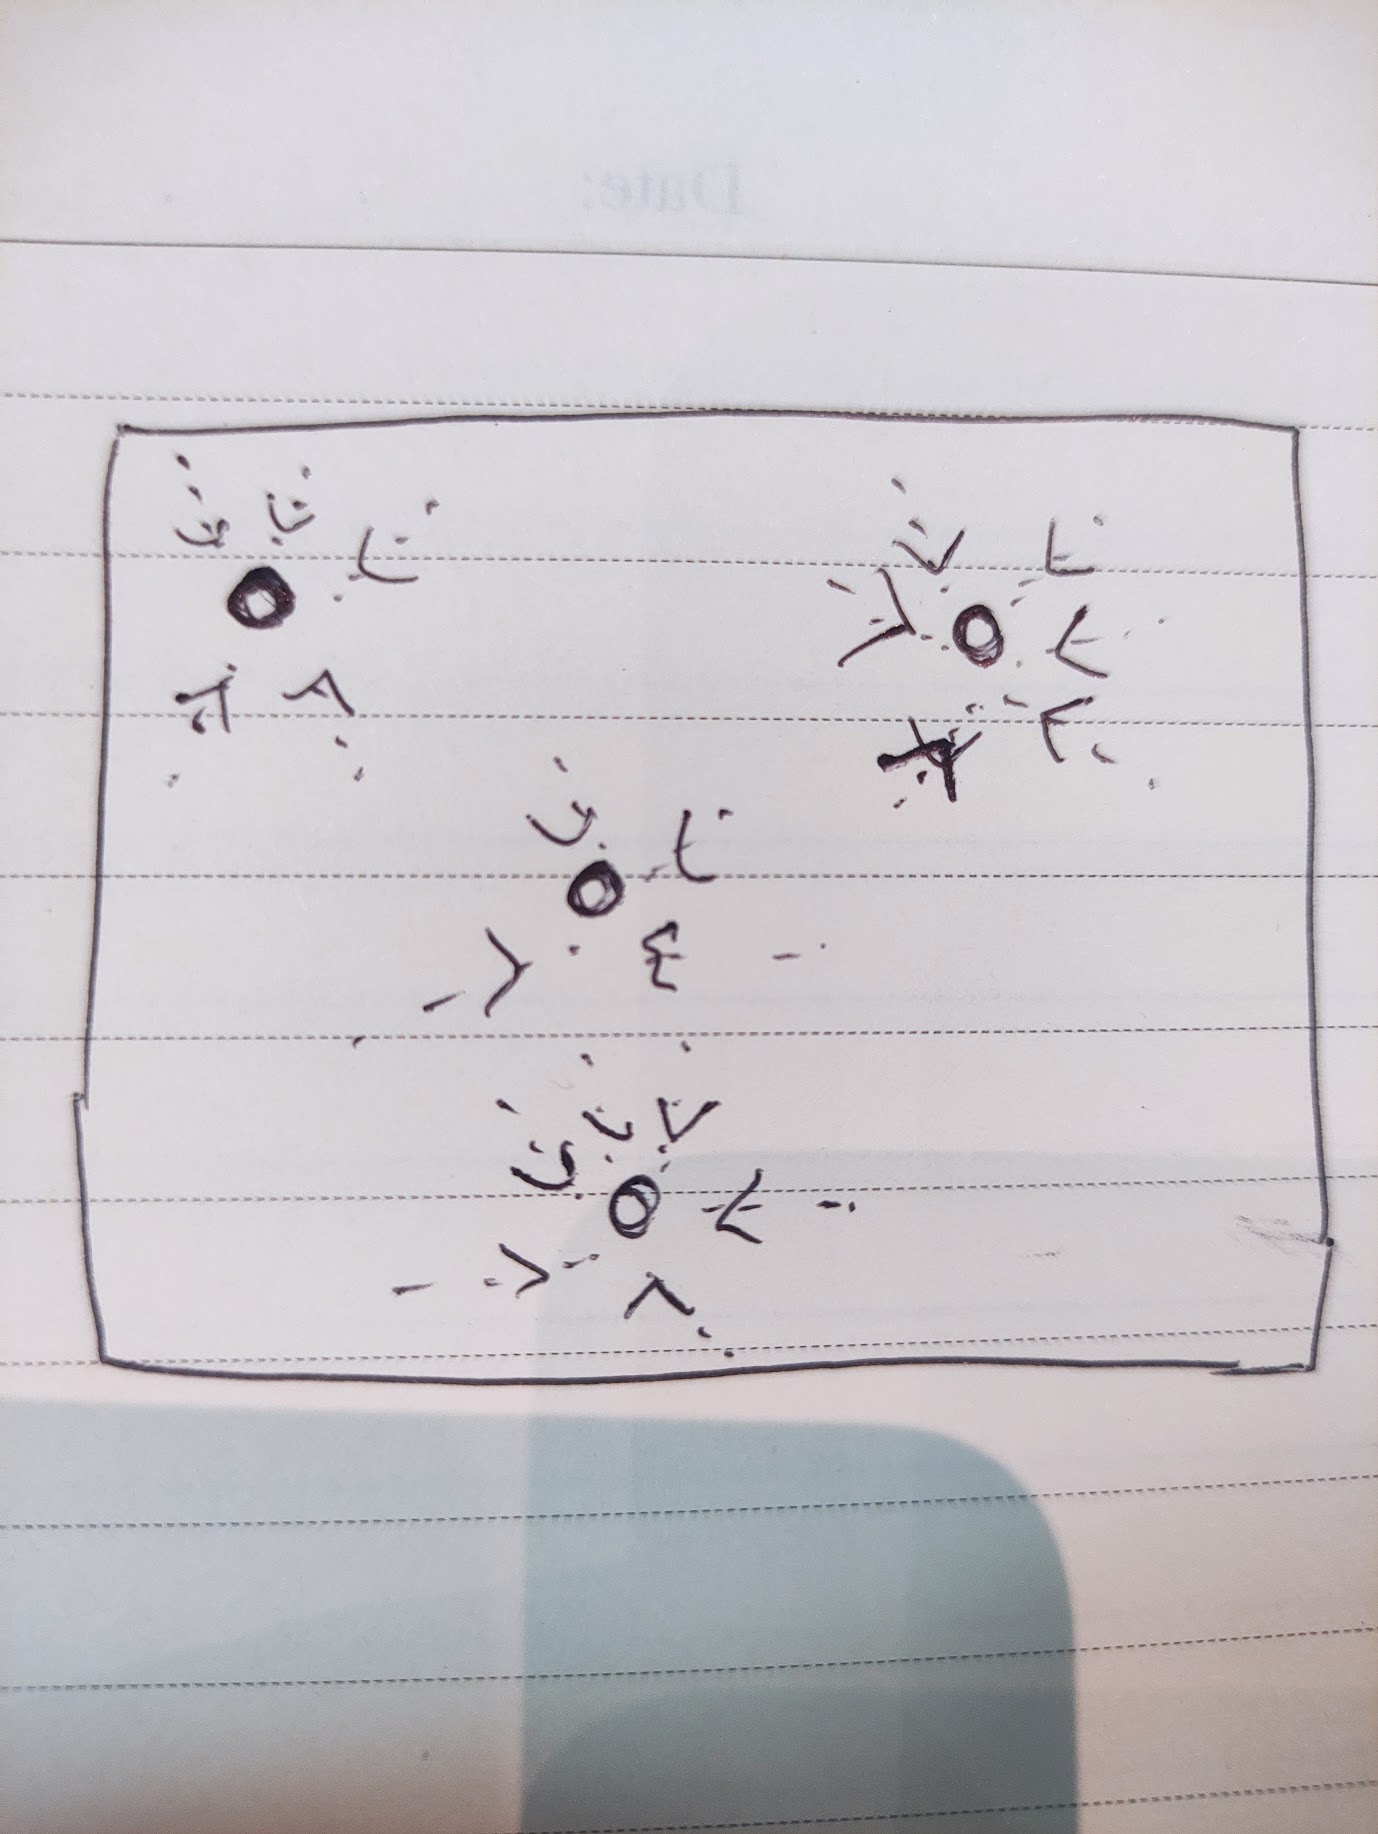
This led to the following initial paper sketch:

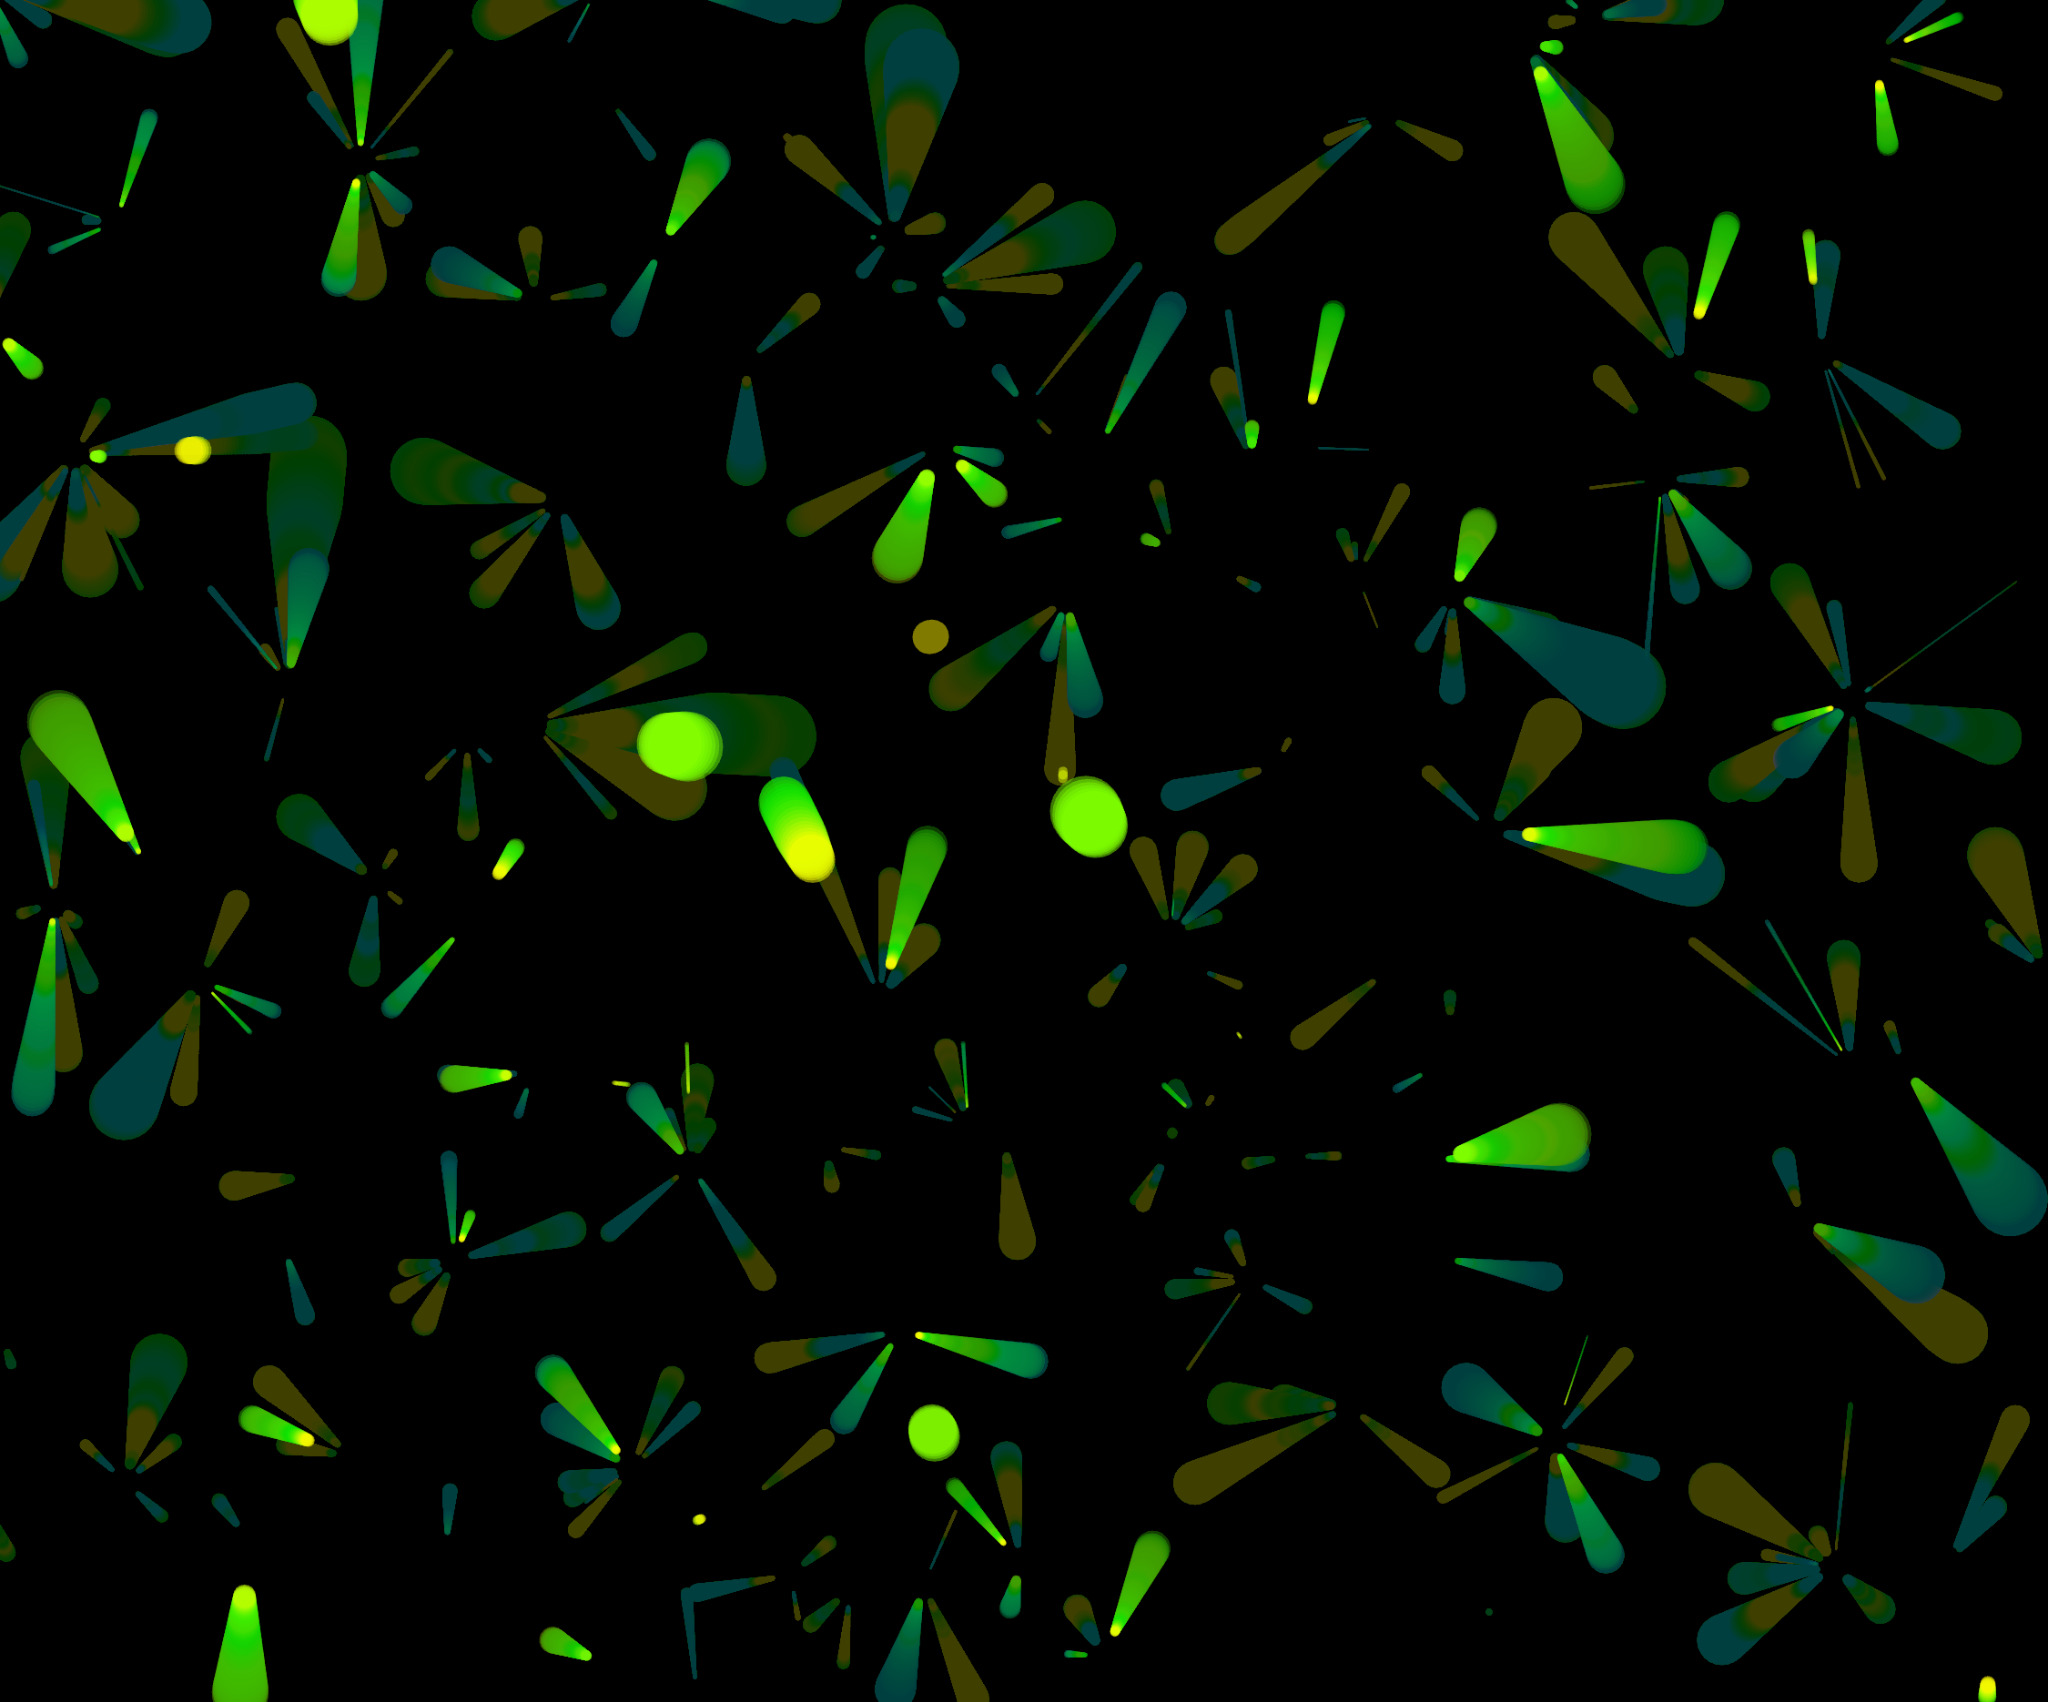
And the final art piece to be the following:

In this piece, there are multiple targets (black holes) and many particles falling in (vehicles).

Interactivity

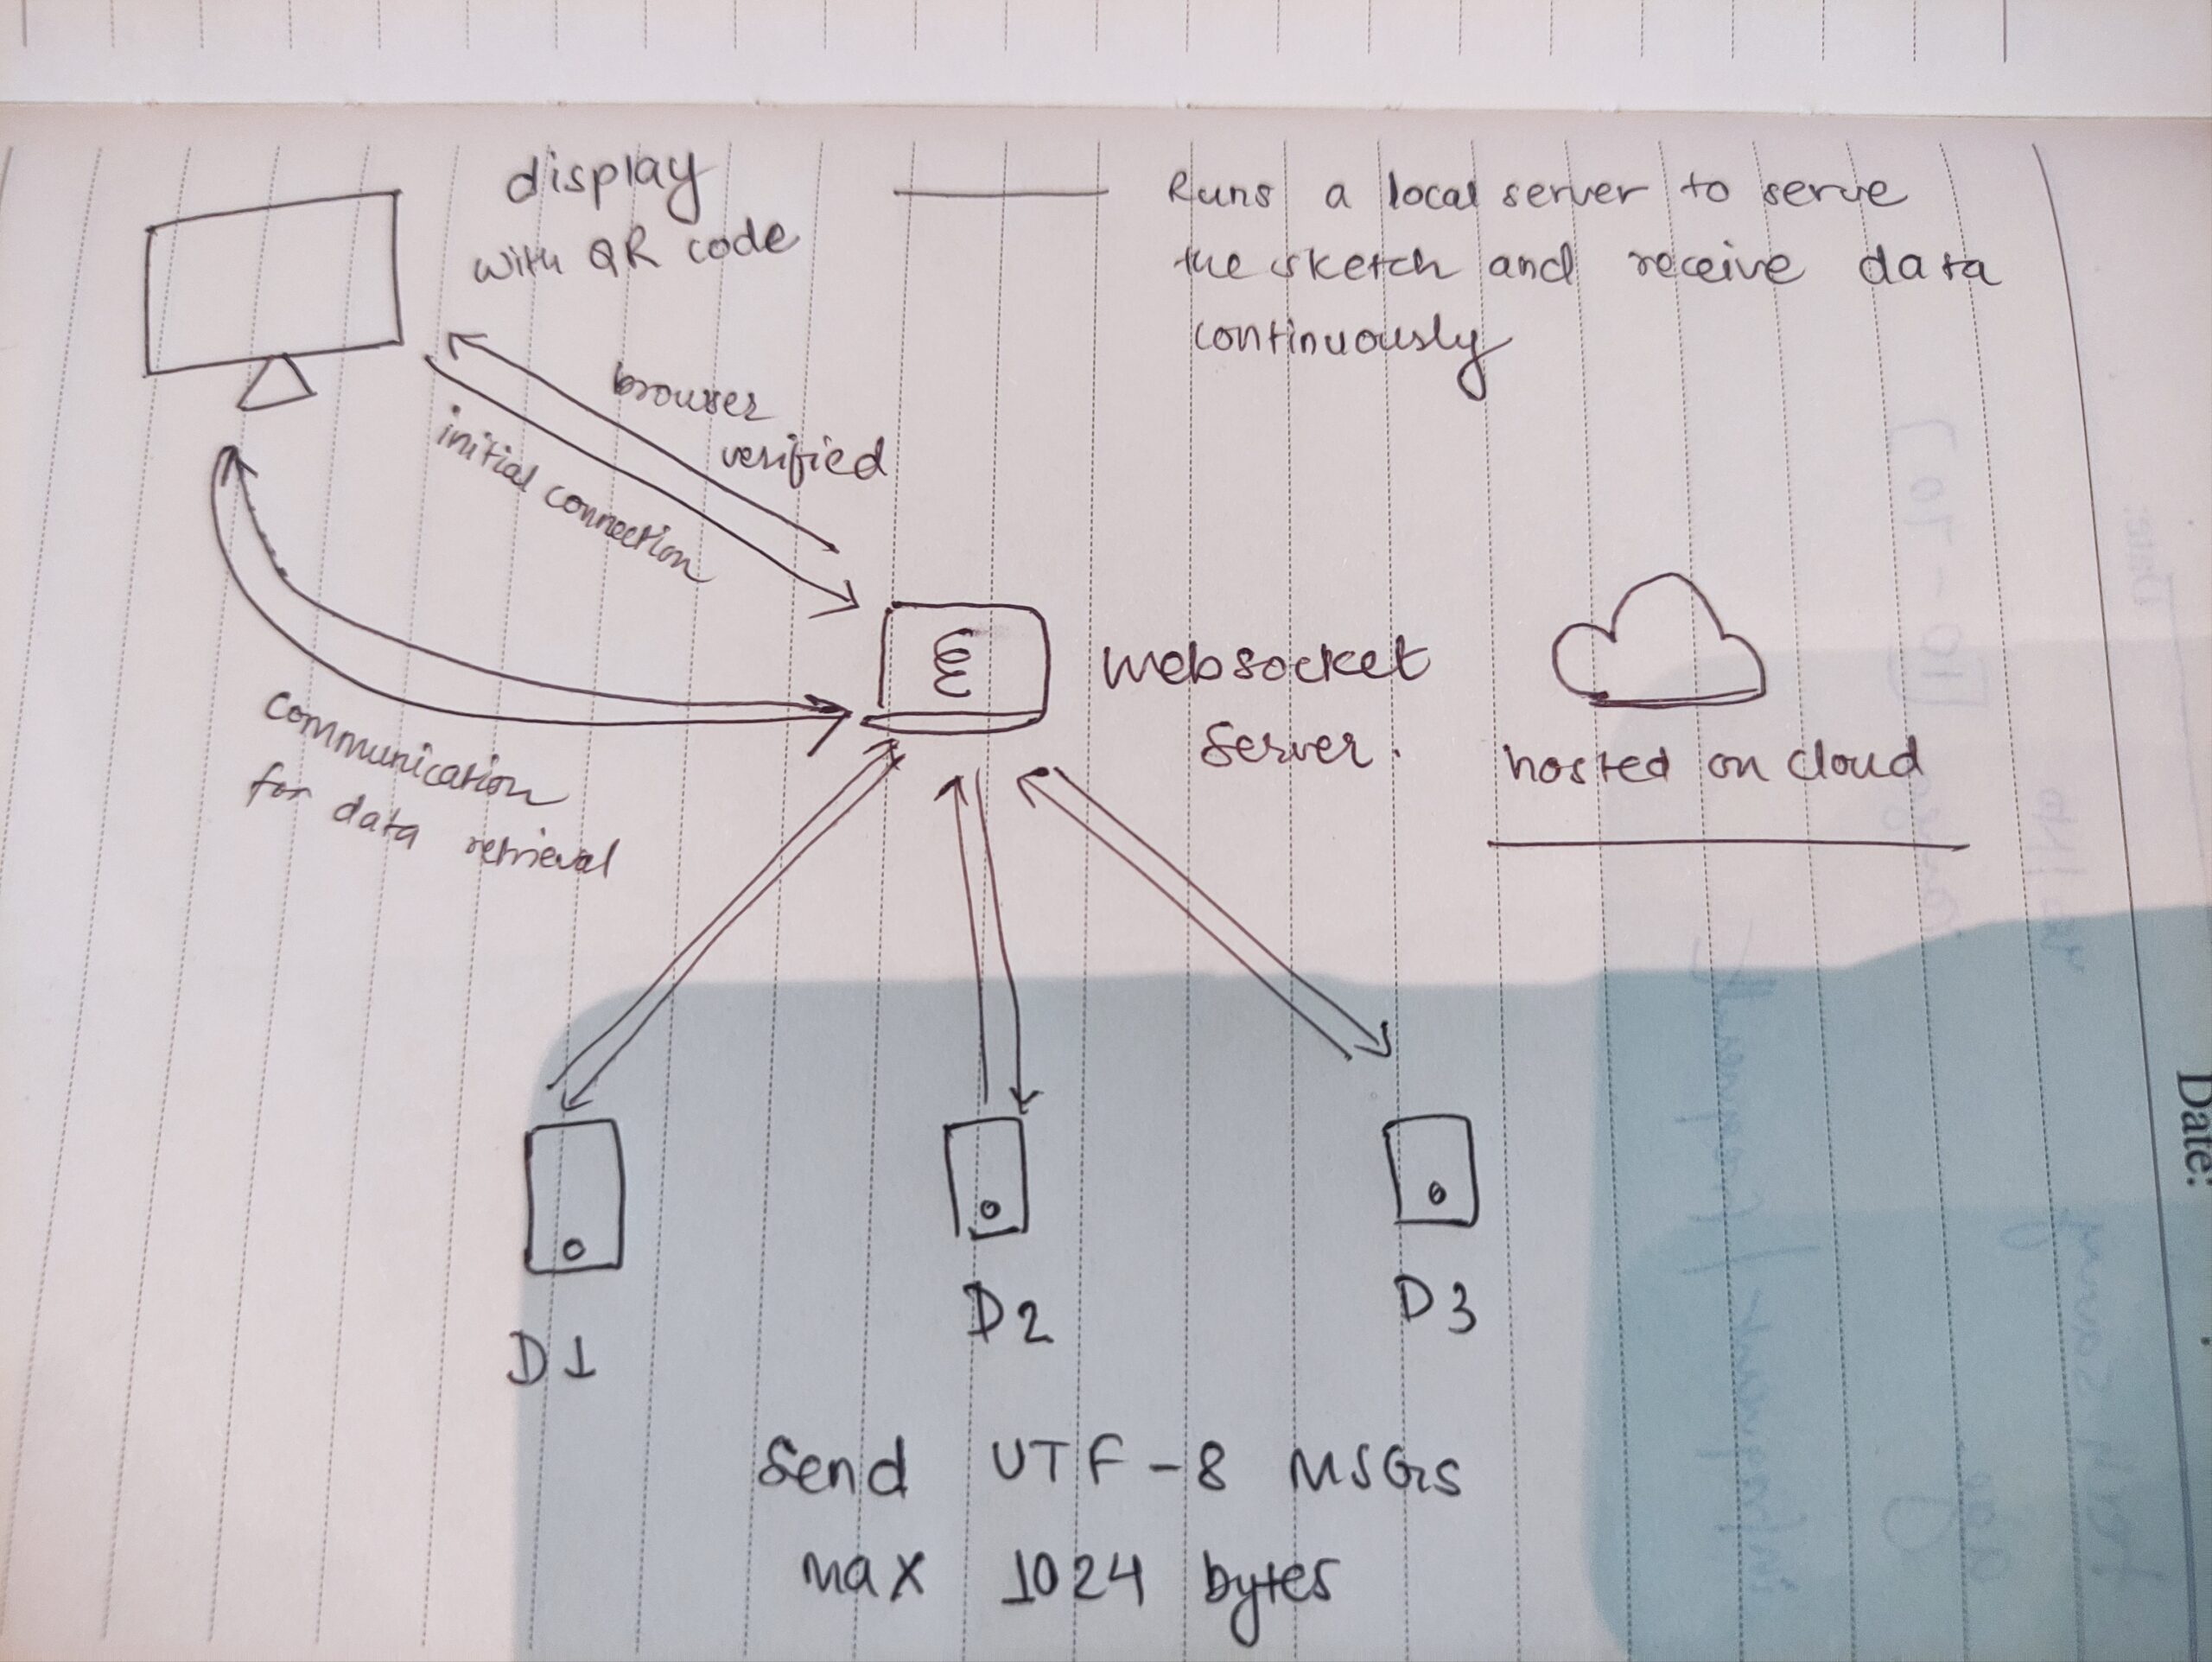
Here’s how interactivity occurs:

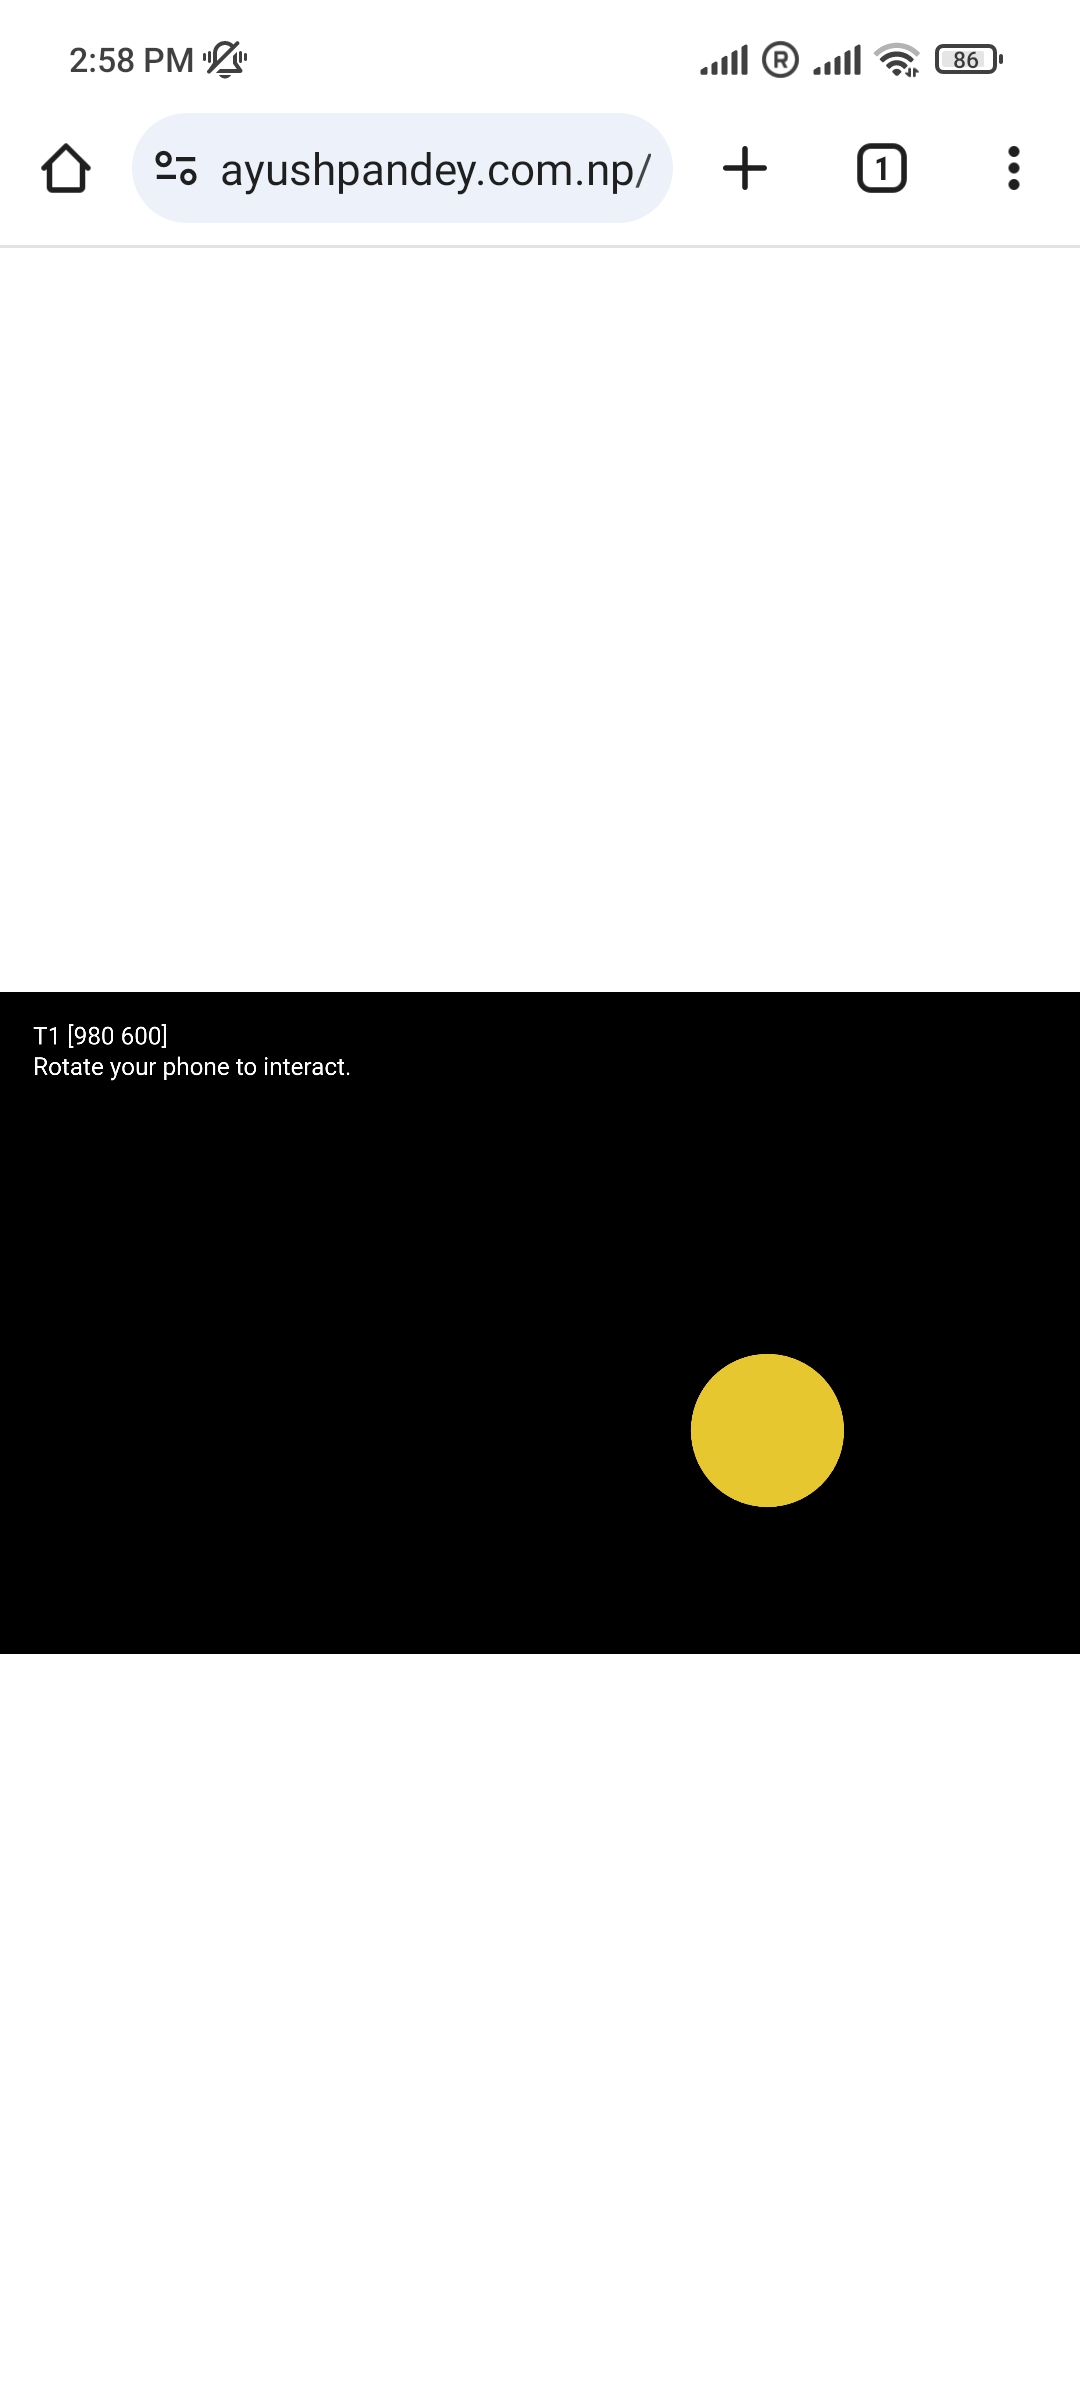
A screenshot of how the client device looks like:

Codebase

I can’t put the code as an online p5 sketch because it will interfere with the communication. That’s because every time it loads up it will send messages to the server.

Here’s a GitHub Repository of the codebase: https://github.com/ayushpandeynp/decoding-nature-final-project

IM Showcase

Here’s a picture from the IM Showcase:

Blackhole Dynamic Exploration

Project


Introduction:

Embark on a fascinating journey into the enigmatic realm of black holes through our interactive simulation project. This walkthrough delves into the intricacies of simulating black holes’ gravitational influence on particles in a 2D space.

Simulation Dynamics:

Our simulation is designed to emulate the gravitational pull of black holes on particles. The setup() function initializes the canvas and GUI interface, allowing users to manipulate parameters such as black hole types, gravitational constant, particle count, and reset functionality.
Particle Behavior:
The Particle class defines particle behavior, including position, velocity, history of movement, and their interaction with black holes. Each particle’s trajectory is influenced by gravitational forces exerted by the black holes, leading to dynamic and visually engaging movements.
Black Hole Representation:
Utilizing the Blackhole class, we represent black holes on the canvas based on their mass and Schwarzschild radius. The visualization showcases their gravitational influence by affecting the trajectories of nearby particles.
Interactive Controls and Rendering:
Our project features an intuitive GUI interface allowing users to dynamically modify parameters, alter particle behavior, and manipulate black hole properties in real-time. This interactivity enhances user engagement and facilitates a deeper understanding of black hole dynamics.
Code Mechanics and Principles:
The core mechanics of our simulation are based on Newtonian gravitational principles, where each particle’s velocity is adjusted according to the gravitational force exerted by nearby black holes. We implement rules to halt particle movement when they enter the event horizon of a black hole, replicating the physics around these cosmic phenomena.
Conclusion:
This code walkthrough provides insight into the simulation of black hole dynamics, illustrating gravitational interactions between particles and black holes. Through this project, users can explore and visualize the captivating behavior surrounding these astronomical entities.

Inspiration:

Papers to be used:
https://digitalcommons.usu.edu/phys_capstoneproject/75/